Figure 4.

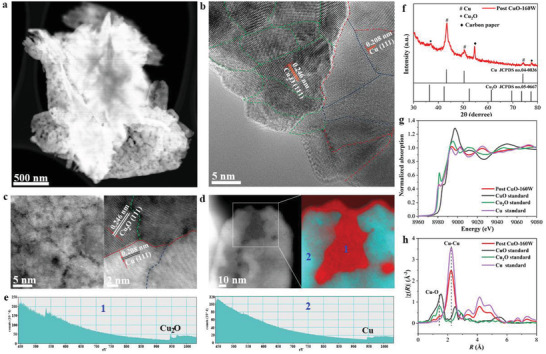
Morphological and compositional analysis of post CuO‐160W after eCO2RR. a) HAADF‐STEM image, b) high‐resolution TEM image, c) high‐resolution HAADF‐STEM image with magnified region of GBs and Cu+/Cu0 interfaces. Green, blue, and red lines in the right‐hand image represent Cu2O GBs, Cu GBs and Cu+/Cu0 interfaces, respectively. d) EELS mapping of Cu+ in 1 and Cu0 in 2, e) Corresponding EELS spectra collected from the areas of 1 and 2 in (d), f) XRD patterns, g) Cu K‐edge XANES spectra, h) Cu K‐edge Fourier transformed EXAFS spectra.
