Figure 2.

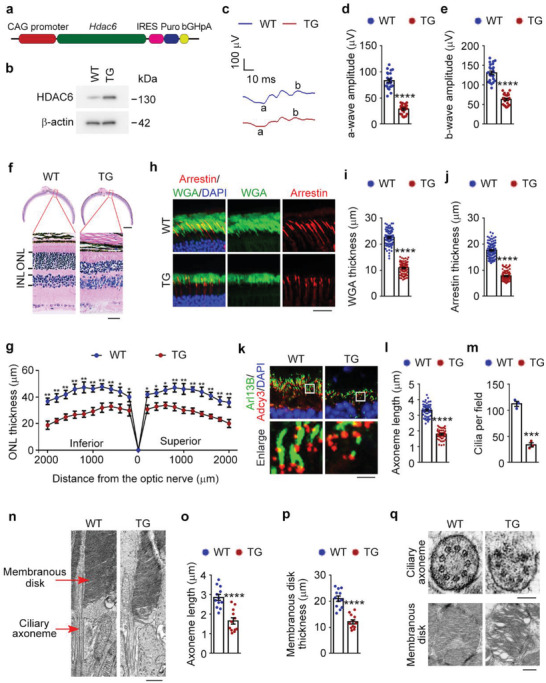
Hdac6 transgenic mice display the pathological changes associated with ROP. a) An illustration of the overexpression vector used to generate the Hdac6 transgenic embryonic stem cell line. The vector containing an Hdac6‐IRES‐Puro cassette downstream of the chicken ACBT (β‐actin; CAG) promoter. b) Immunoblot analysis of HDAC6 and β‐actin in retinas from 8‐week‐old wild‐type (WT) and Hdac6 transgenic (TG) mice. c–e) ERG recordings c) and measurement of retinal a‐wave d) and b‐wave e) amplitudes in wild‐type and Hdac6 transgenic mice under scotopic conditions at 3 cd s m−2 flash intensity (n = 24 mice from three independent experiments). f,g) Photomicrographs f) and quantification g) of the retinal histology assessed by H&E staining in wild‐type and Hdac6 transgenic mice (n = 90 fields from 12 mice of three independent experiments). Scale bars, 0.3 mm (top) and 30 µm (bottom). h–j) Immunofluorescence images h) and quantification of the thickness of outer segment membranous disk in rods i) and cones j) from wild‐type and Hdac6 transgenic mice (n = 90 fields from 12 mice of three independent experiments). Scale bar, 20 µm. k–m) Immunofluorescence images k) and quantification of the length (l, n = 90 fields from 12 mice of three independent experiments) and density (m, n = 3 independent experiments from 12 mice) of ciliary axonemes in retinas from wild‐type and Hdac6 transgenic mice. Scale bar, 3 µm. n–p) Transmission electron microscopy images n) and quantification of the length of ciliary axonemes o) and the thickness of membranous disks p) of the longitudinal sections of photoreceptors in wild‐type and Hdac6 transgenic mice (n = 12 retinas from 6 mice of three independent experiments). Scale bar, 1 µm. q) Transmission electron microscopy images of the cross sections of ciliary axonemes and membranous disks in wild‐type and Hdac6 transgenic mice. Scale bars, 0.1 µm (top) and 0.5 µm (bottom). Data are presented as mean ± SEM. *p < 0.05, **p < 0.01, ***p < 0.001, ****p < 0.0001.
