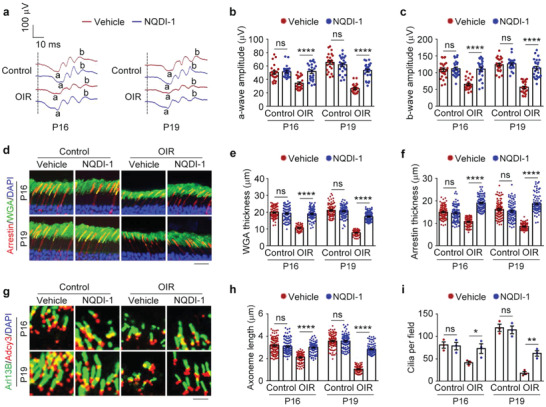
Figure 6.

Targeting signaling molecules upstream of HDAC6 blocks the pathological changes associated with ROP. a–c) ERG recordings a) and measurement of retinal a‐wave b) and b‐wave c) amplitudes in control and OIR mice intravitreally injected with NQDI‐1 or vehicle. Stimulus flash at 3 cd s m−2 was used to elicit the ERGs under scotopic conditions (n = 24 mice from three independent experiments). d–f) Immunofluorescence images d) and quantification of the thickness of outer segment membranous disks of rods e) and cones f) from control and OIR mice intravitreally injected with NQDI‐1 or vehicle (n = 90 fields from 12 mice of three independent experiments). Scale bar, 20 µm. g–i) Immunofluorescence images g) and quantification of the length (h, n = 90 fields from three independent experiments) and density (i, n = 3 independent experiments from 12 mice) of ciliary axonemes in retinas from control and OIR mice intravitreally injected with NQDI‐1 or vehicle. Scale bar, 3 µm. Data are presented as mean ± SEM. *p < 0.05, **p < 0.01, ****p < 0.0001; ns, not significant.
