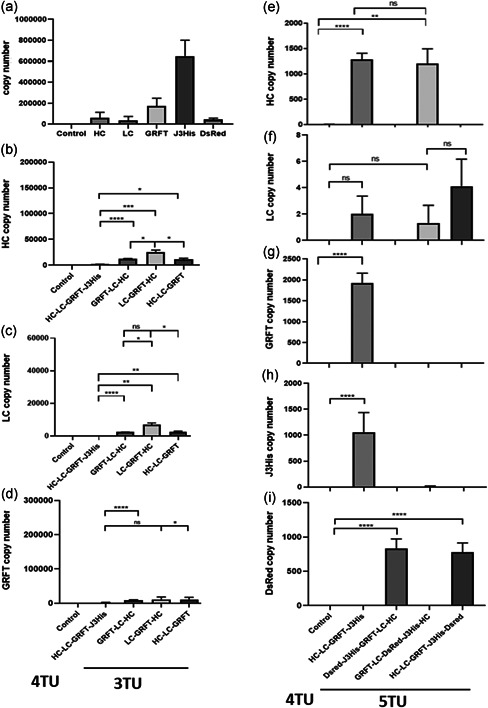
Figure 4.

Quantification of mRNA levels of Nicotiana benthamiana leaves infiltrated with MIDAS‐P constructs harboring different combinations of transcription units. (a) Positive controls showing mRNA levels in leaves infiltrated with MIDAS‐P constructs carrying two TUs for VRC01 heavy chain (HC) and light chain (LC), or a single TU for expression of Griffithsin (GRFT), 6xHis‐tagged J3‐VHH (J3His) or DsRed
(b–d) VRC01 HC (b), LC (c) and GRFT (d) mRNA levels in leaves infiltrated with MIDAS‐P constructs with different permutations of 3 TUs expressing VRC01 HC, LC, and GRFT; or with 4 TUs (additional TU expressing J3His), compared with the respective positive controls on Figure (a) (J3His data not shown). Data for (b), (c), and (d) were analyzed using Brown‐Forsythe and Welch ANOVA tests followed by Tamhane T2 multiple comparison test (****p < 0.0001; **p < 0.01, *p < 0.05). (e–i) VRC01 HC (e), LC (f), GRFT (g), J3His (h), and DsRed (i) mRNA levels in leaves infiltrated with MIDAS‐P constructs with different permutations of 5 TUs expressing the 5 genes and a repeat of the 4 TU construct from (b–d), compared with the respective positive controls on Figure (a). Please refer to Figure 4i for x‐axis labels of e–h. Data for (e), (g), and (i) were analyzed using Brown‐Forsythe and Welch ANOVA tests with Tamhane T2 multiple comparison test; (f) and (h) were analyzed using Dunn Bonferroni multiple comparison test (LC: Kruskal–Wallis test statistic = 6.7; J3His vs. HC‐LC‐GRFT‐J3His p < 0.0001, Kruskal–Wallis test statistic = 40.2). Leaves from plants infiltrated with infiltration solution served as negative control (“Control”). mRNA levels were determined with qPCR using the primers listed in Table S2. All data represent the mean of three biological repeats ± SD. ANOVA, analysis of variance; mRNA, messenger RNA; TUs, transcription units; SD, standard deviation
