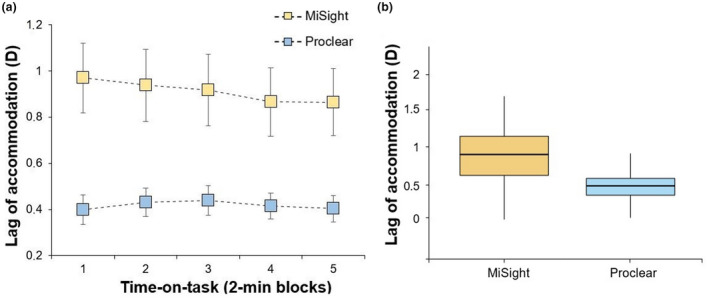
FIGURE 3.

(a) Mean lag of accommodation during the five time‐on‐task blocks for the MiSight and Proclear lenses. Error bars indicate one standard error. (b) Boxplot showing the mean lag, with the whiskers extending 1.5 times the interquartile range from the 25th and 75th percentiles
