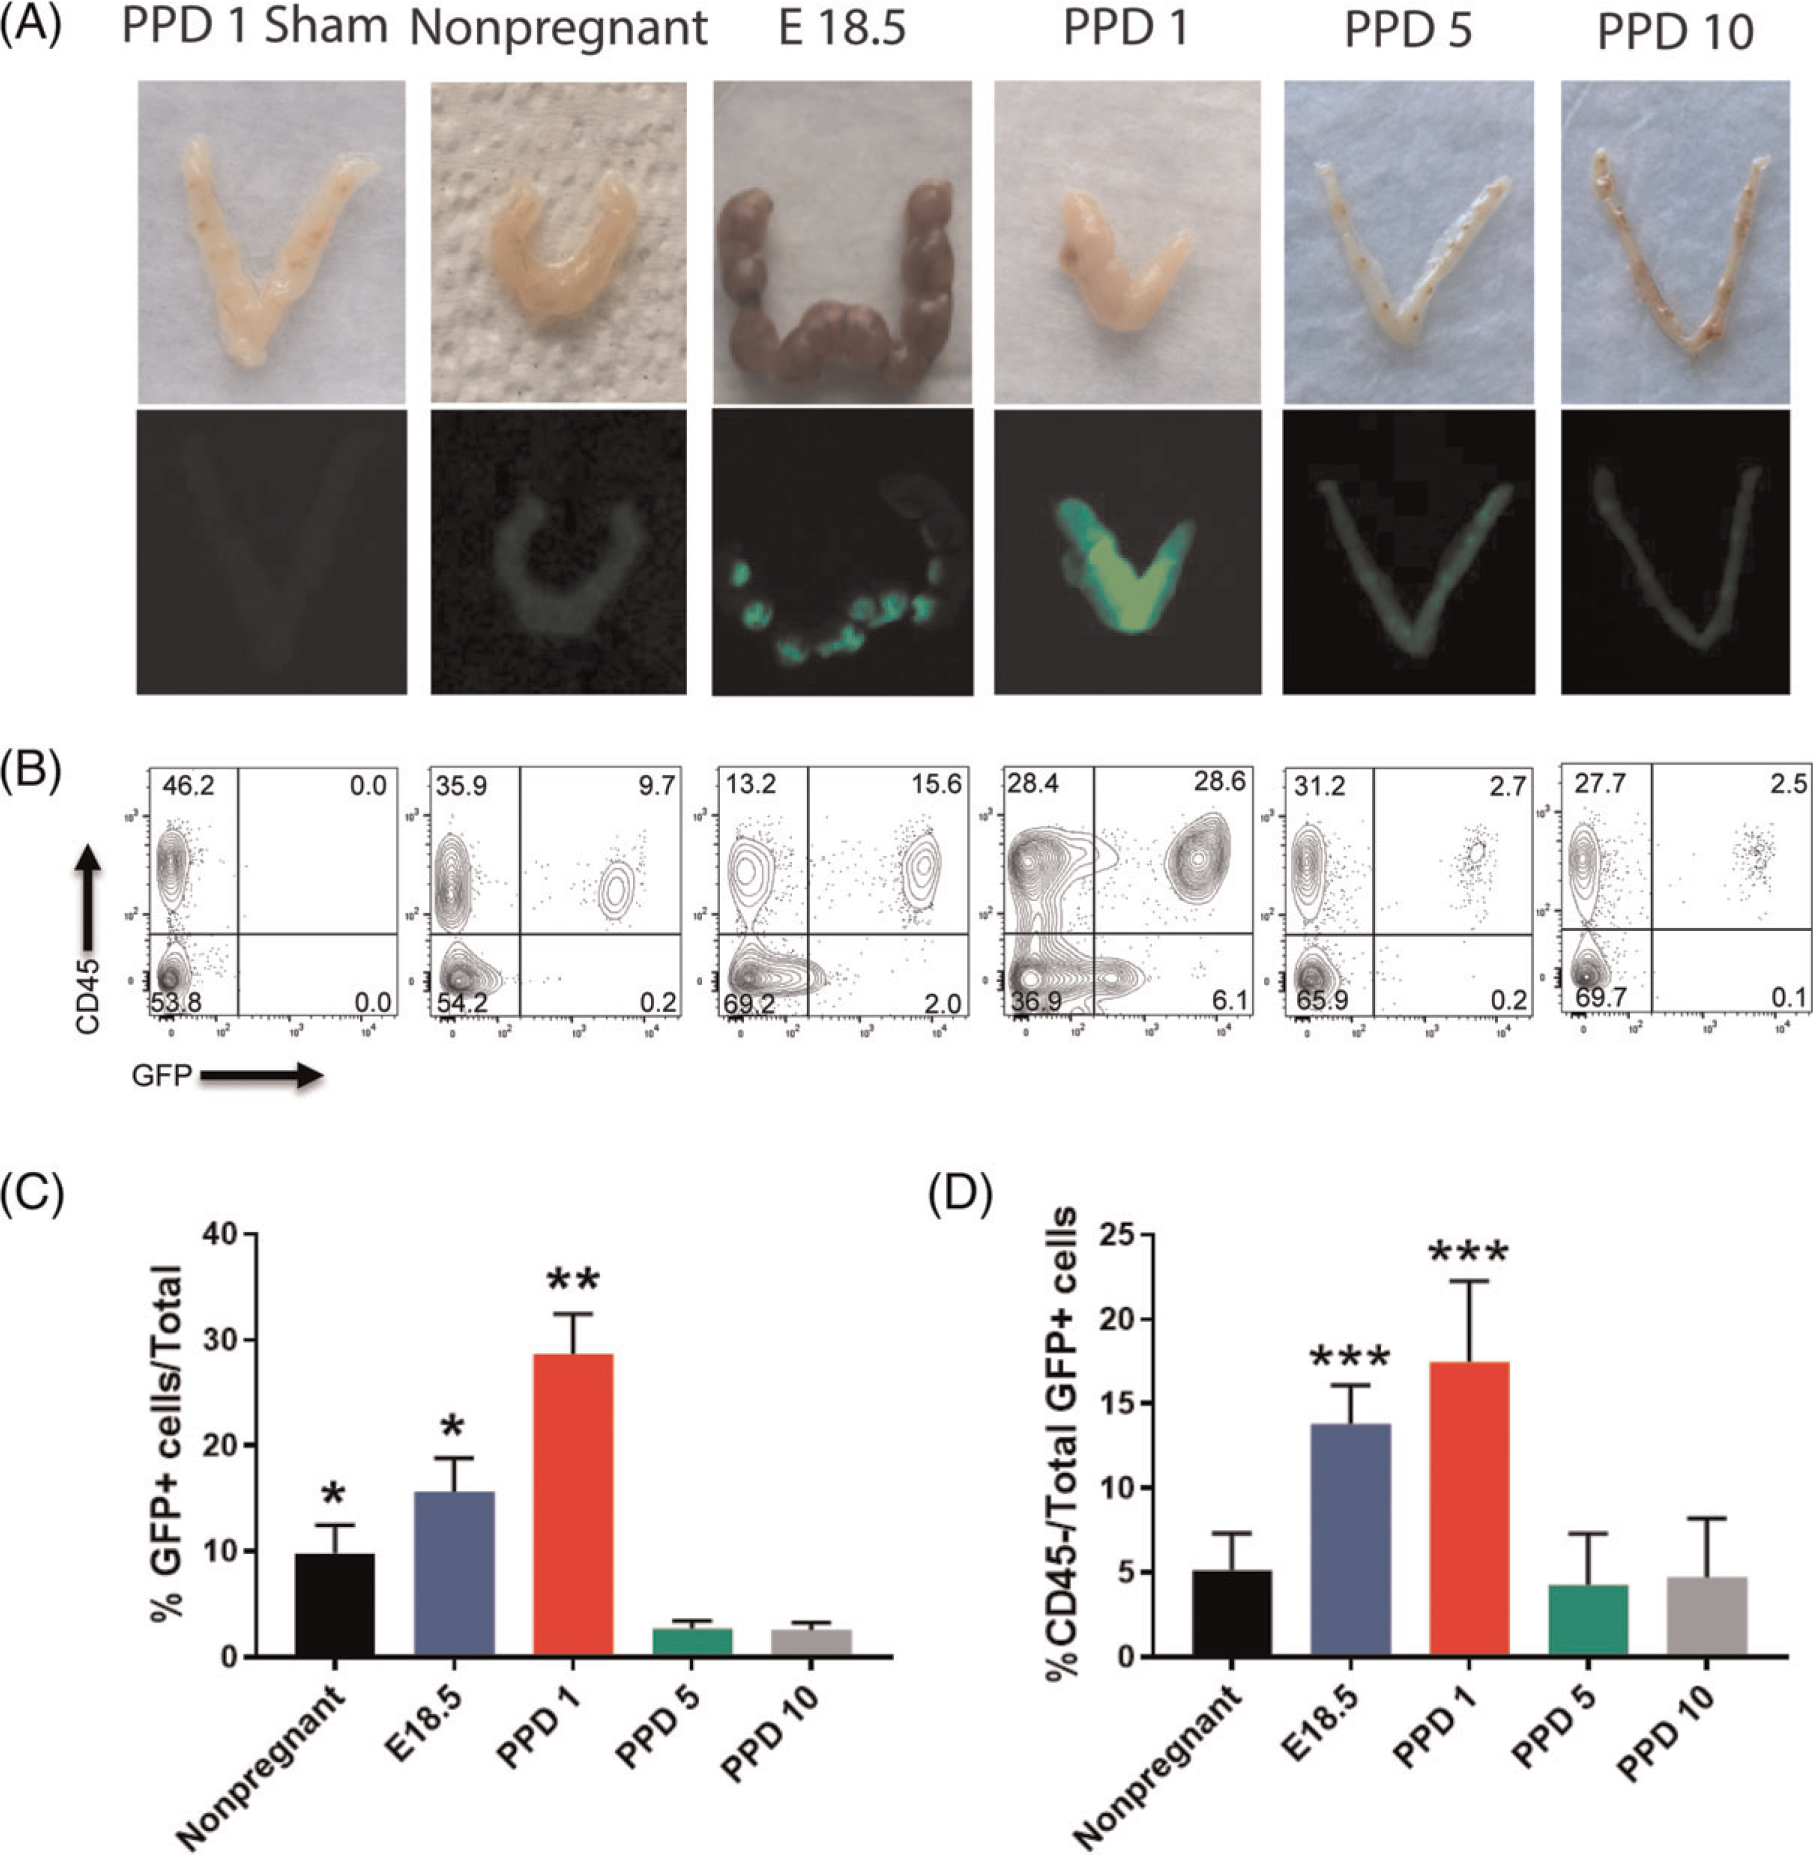
Figure 2. Temporal contribution of bone marrow-derived cells (BMDCs) to the uterus in peripartum and postpartum period.

(A) Photographs of uteri (top panel) and fluorescent GFP images obtained by fluorescent camera (bottom panel) from various peripartum and postpartum time points (E18.5, PPD1, 5, 10 and nonpregnant) of mice engrafted with BM from GFP donors. The negative control is PPD1 uterus from a mouse injected with PBS (sham). The white arrows point to the areas of preferential BMDCs localization within E18.5 implantation sites. (B) Representative flow cytometry plots of single cells from uterine tissue gated according to CD45 and GFP positivity showing the changes in CD45+ (hematopoietic) and CD45-GFP+(nonhematopoietic) BMDC populations throughout peripartum and postpartum period. Flow cytometry values shown on plots are representative from one experiment. (C) Quantitative summary of flow cytometry analysis showing %GFP+ cells out of total uterine cells throughout peripartum/postpartum period. (D) Quantitative summary of flow cytometry analysis showing %CD45-nonhematopoietic cells out of total uterine GFP+ BMDC cell population throughout peripartum/postpartum period. Nonpregnant (n = 6), E18.5 (n = 6), PPD1 (n = 6), PPD5 (n = 5), PPD10 (n = 6), PPD1 sham (n = 4). *P < 0.05 vs PPD5 and PPD10 groups; **P < 0.01 vs all other groups; ***P < 0.05 vs nonpregnant, PPD5 and PPD10 groups
