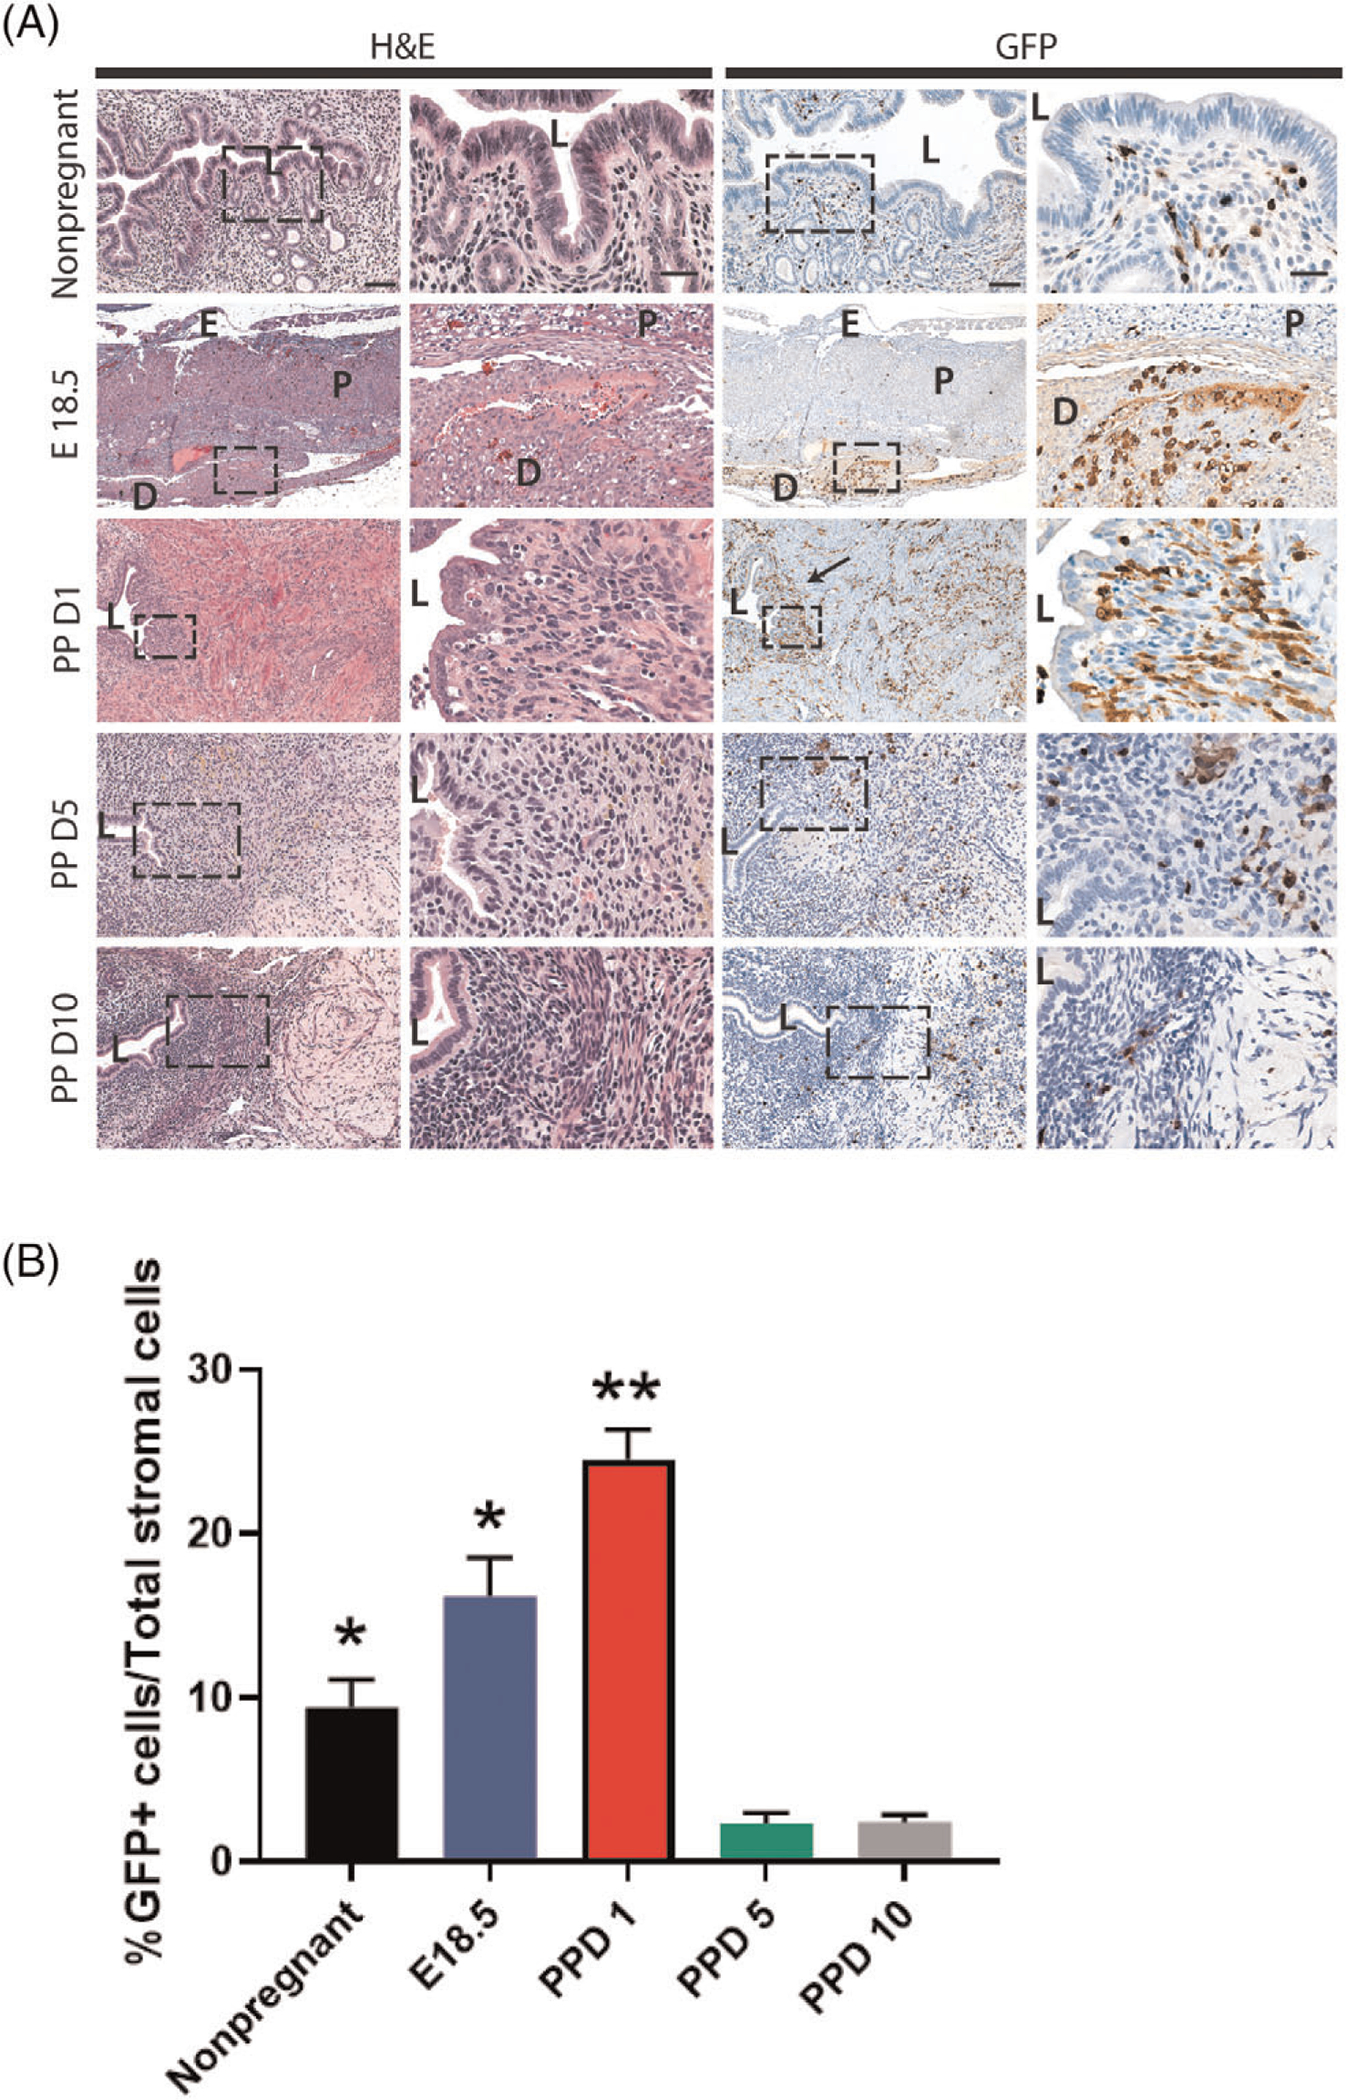
Figure 3. Localization of bone marrow-derived cells (BMDCs) in the postpartum uterus.

(A) Histological uterine tissue sections of different gestational and postpartum timepoints. Left panel shows H&E staining while right panel shows immunostaining with GFP antibody (brown). Low magnification (10x) and high magnification (20x) images are shown. The right column in each panel is a magnification of the corresponding rectangular area marked by the dashed line. The size bars in the left and right columns correspond to 100 μm and 50 μm, respectively. Black arrow is pointing to subepithelial area where GFP+ BMDCs (brown) are particularly abundant. (B) Quantitative summary of percentage of GFP+ cells out of total stromal cells across different time points. PPD1 (n = 5 animals); n = 4 in all other groups. *P < 0.05 vs PPD5 and PPD10, **P < 0.01 vs all other groups. L, lumen; D, decidua; P, placenta; E, Embryo
