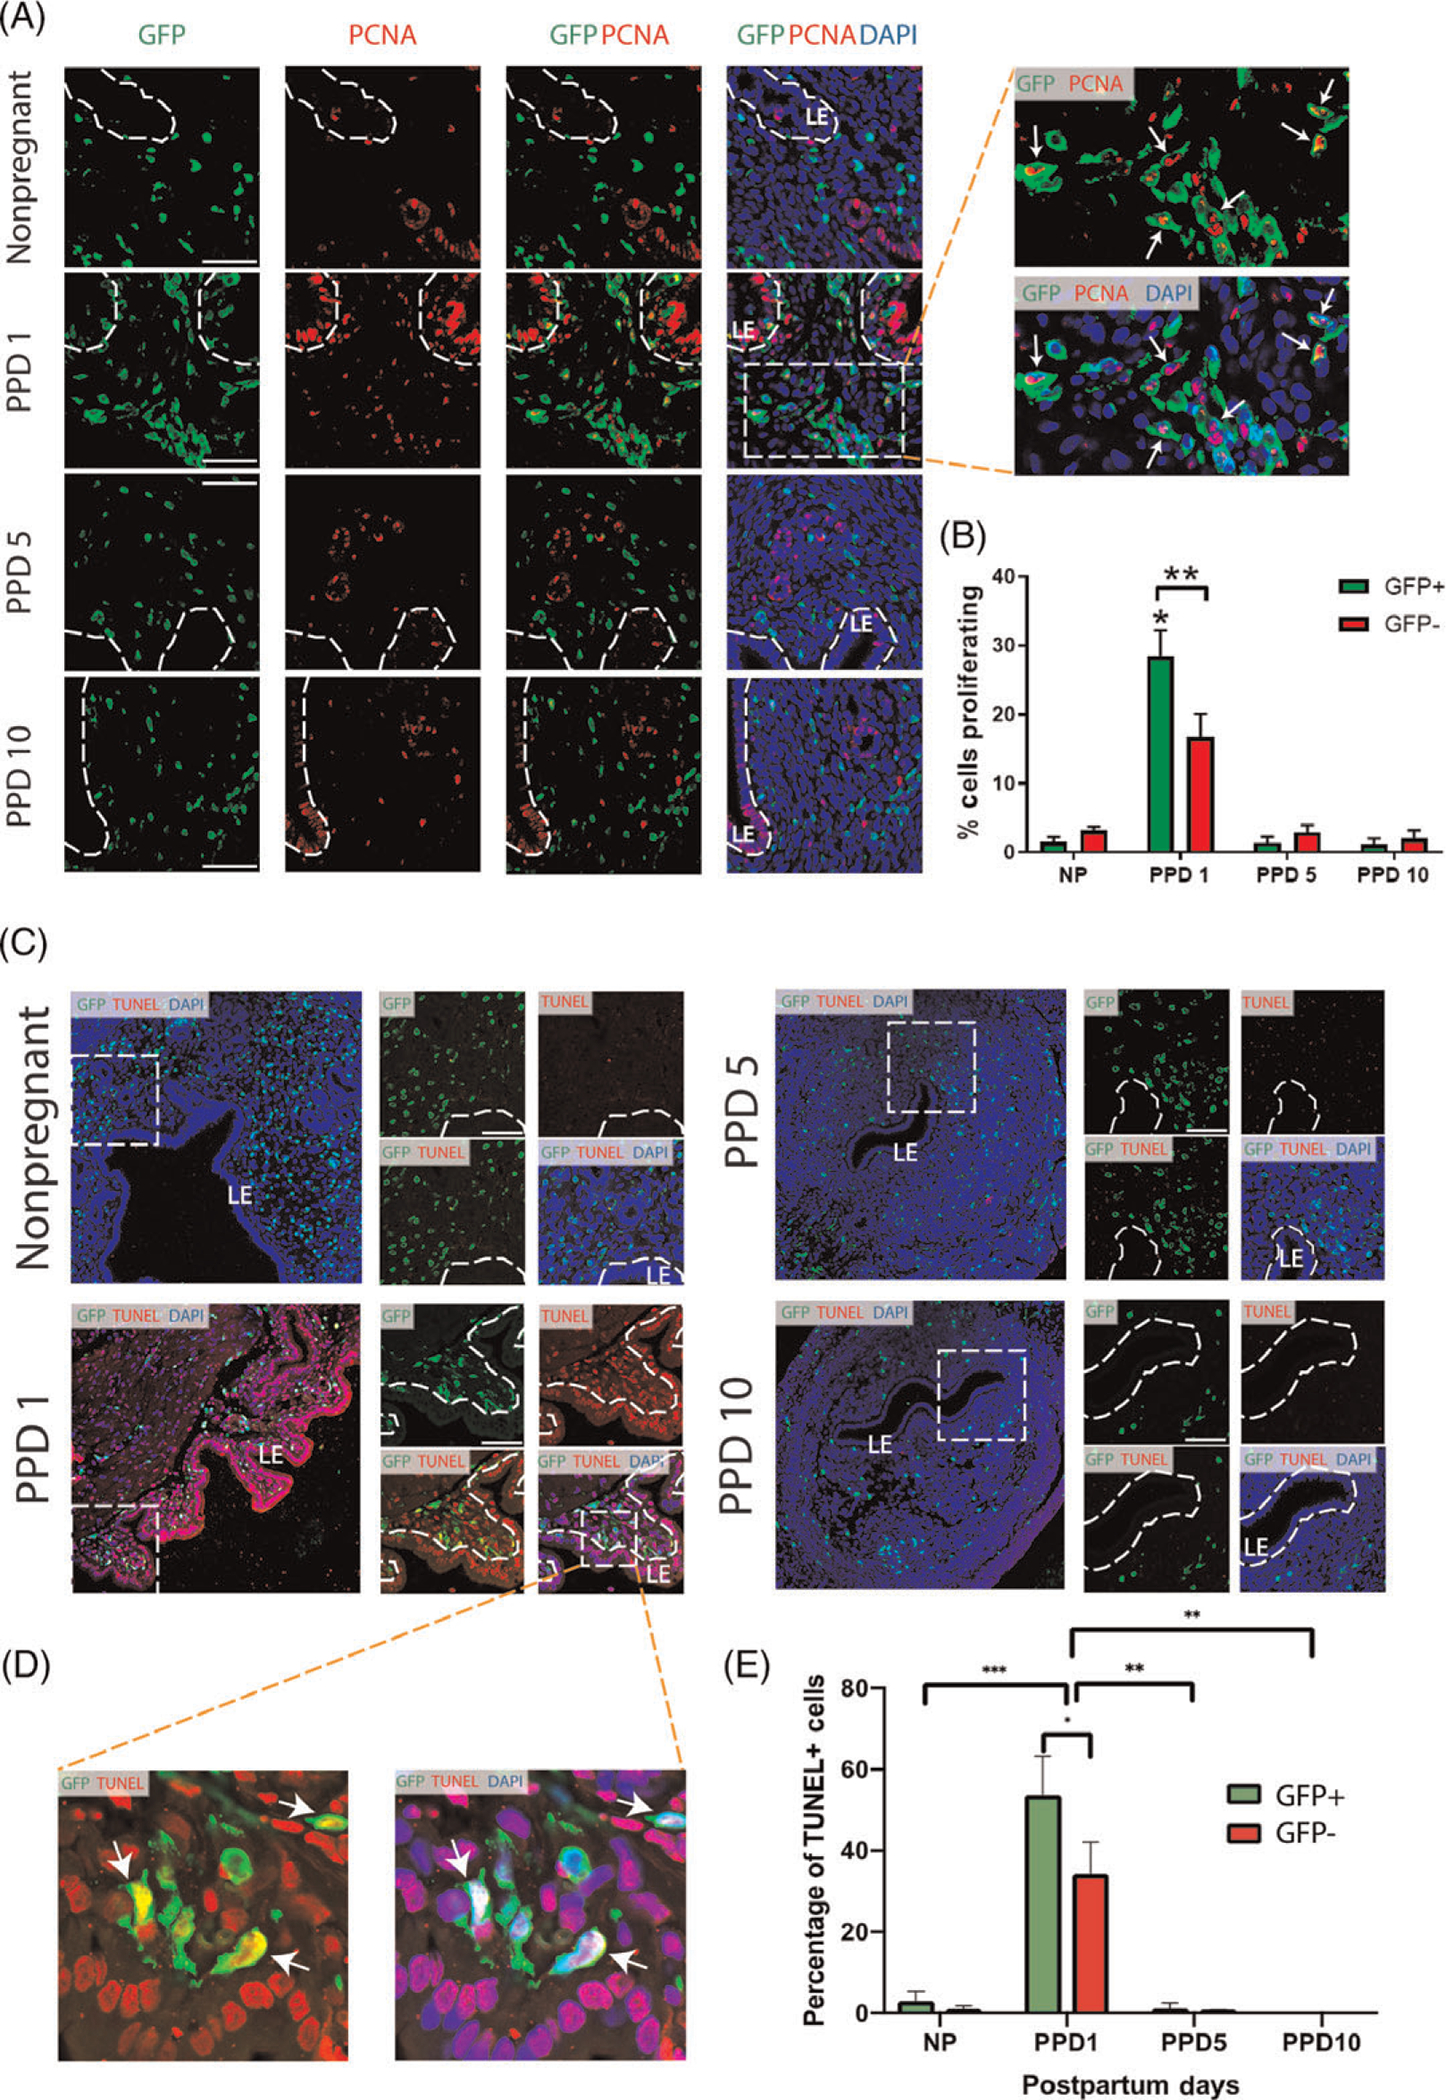
Figure 6. Proliferation and apoptosis of BMDCs in the postpartum period.

(A) Immunofluorescence of uterine tissue sections showing colocalization of GFP-positive BMDCs (green), with the proliferation marker PCNA (red) across nonpregnant and postpartum day (PPD) 1, 5 and 10. Sections were counterstained with DAPI (blue) for nuclear staining. The dashed white line indicates the border of the luminal epithelium (LE). Magnified images to the right have white arrows pointing to numerous proliferative (PCNA+) GFP+ bone-marrow derived cells on PPD1. (B) Quantitative summary of percentage of cells proliferating among GFP+ and GFP− cell populations across different time points. PPD1 (n = 5 animals); n = 4 in all other groups. * P < 0.01 vs all other groups; ** P < 0.05. Images were obtained with 40x lens. Scale bar = 50 μm. (C) Immunofluorescence of uterine tissue sections showing colocalization of GFP-positive BMDCs (green), with TUNEL apoptosis staining (red) across nonpregnant and postpartum day (PPD) 1, 5 and 10. Sections were counterstained with DAPI (blue) for nuclear staining. Smaller images on the right are a magnification of the respective white dashed square area on the left. The dashed white line indicates the border of the luminal epithelium (LE). White arrows point to GFP-positive BMDCs that are positive for TUNEL apoptosis marker. (D) Magnified images of dashed white area from PPD1 have white arrows pointing to apoptotic (TUENL+) GFP+ bone-marrow derived cells. (E) Quantitative summary of percentage of apoptotic (TUNEL+) cells within GFP+ and GFP− cell populations across different time points. PPD1 (n = 5 animals); n = 4 in all other groups. *P < 0.05, **P < 0.01, ***P < 0.001. Images were obtained with 40x lens. Scale bar = 50 μm.
