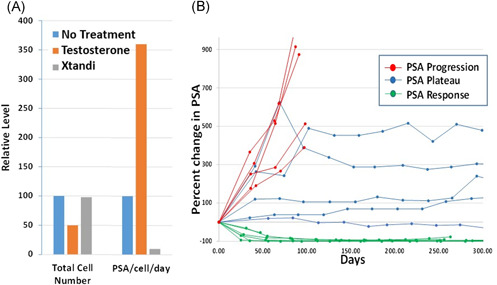
Figure 4.

(A) Human prostate cancer cells growing in the lab are growth inhibited by 50% when exposed to testosterone (orange bar) while Xtandi (gray bar) has no effect on growth compared to no treatment (blue bar). Despite a 50% decrease in cell number, testosterone‐treated cells increase production of PSA by 3.5‐fold (orange bar) compared to untreated cells (blue bar). While Xtandi has no effect on growth of cells it reduces PSA production by >90% (gray bar). (B) Three patterns of PSA response in representative patients treated with BAT. These three patterns include those with “PSA response,” those with stable disease (“PSA plateau”), and those with “PSA progression.” BAT, bipolar androgen therapy; PSA, prostate‐specific antigen. [Color figure can be viewed at wileyonlinelibrary.com]
