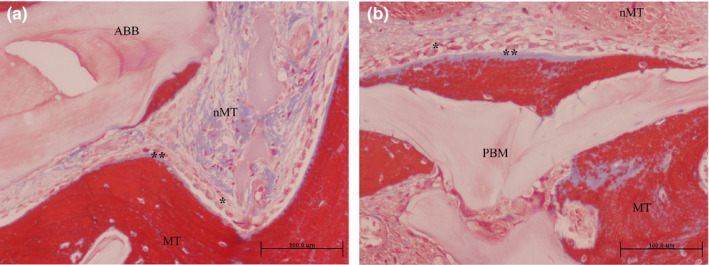
FIGURE 3.

Grafted area with active osteogenesis as determined by the presence of osteoblastic (*) and osteoid lines (**) in (a) ACB+ABB and (b) ACB+PBM groups. Masson trichrome staining. Original magnification 20×; bar scale: 100 μm. ABB, anorganic bovine bone; MT, mineralized tissue; nMT, non‐mineralized tissue; PBM, porcine bone mineral
