FIGURE 6.

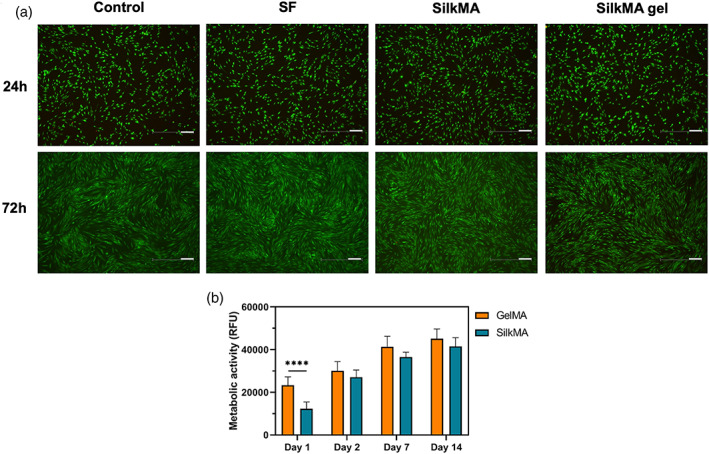
Cytocompatibility study: (A) Live/Dead images of HDFs seeded on tissue culture well‐plates with media (control) and SF/SilkMA solutions and SilkMA gels in inserts (n = 3). Scale bar = 200 μm. (B) Quantification of the metabolic activity of HDFs seeded on SilkMA and GelMA hydrogels by AlamarBlue assay 1, 2, 7, and 14 days after cell seeding (n = 5). Data presented as mean value ± SD (*****p<.0001)
