
FIGURE 3.
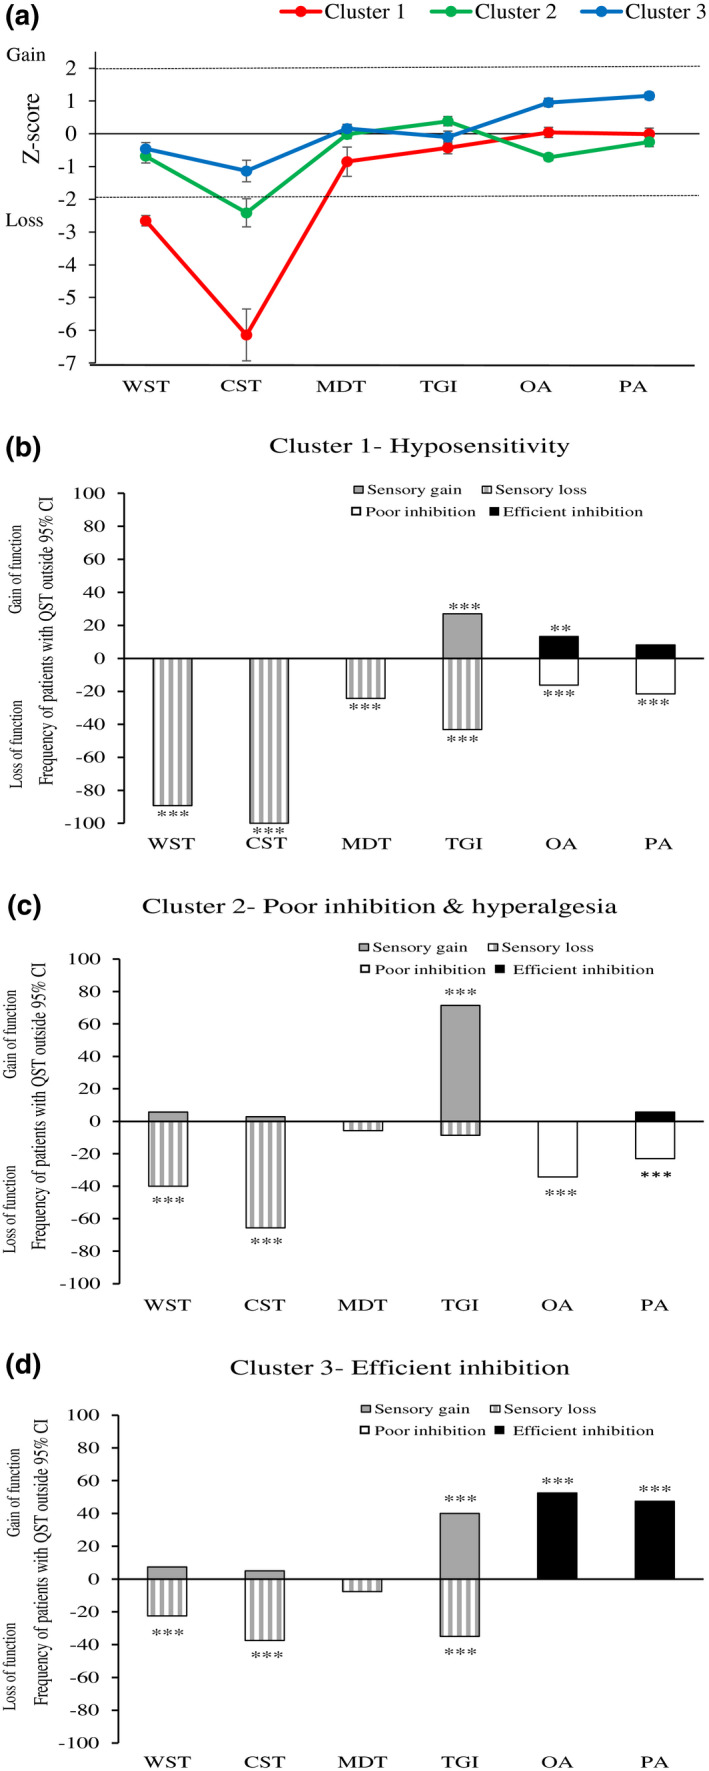
(a) Sensory profiles of the three clusters presented as mean z‐scores ±95% confidence interval: dashed lines represent 95% confidence interval for healthy participants (−1.96 < z < +1.96). Values are significantly different from those of healthy participants, if their 95% confidence interval does not cross the zero line. (b–d) Values are frequencies of patients with abnormal QST (beyond 95% CI of healthy participants) within Cluster 1(B), Cluster 2 (C) and Cluster 3 (D) (asterisks signify comparison to expected, normal values 2.5%; *p < 0.05, **p < 0.01, ***p < 0.001). For WST, CST, MDT, and TGI, negative bars indicate loss of sensibility (hypoesthesia, hypoalgesia), and positive bars indicate gain of sensibility (hyperesthesia, hyperalgesia). For OA and PA, negative bars indicate poor pain inhibition, and positive bars indicate efficient pain inhibition. WST=Warm sensation threshold, CST=Cold sensation threshold, MDT=Mechanical detection threshold, TGI=Thermal grill illusion, OA=Offset analgesia, PA=Pain adaptation