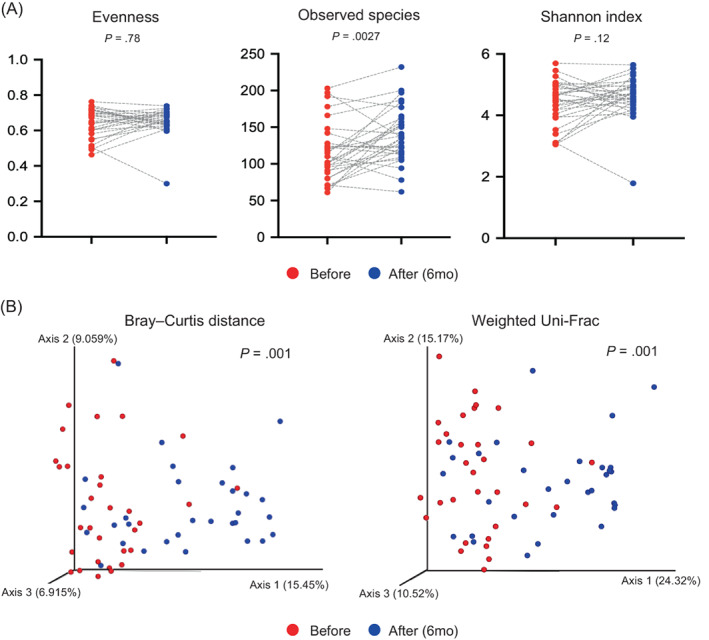
FIGURE 1.

Changes in gut microbiome diversity. A, Boxplot of alpha diversity in patients before surgery and 6 months after surgery by evenness, observed features, and Shannon index. The grey dashed lines indicate the pairs connecting subjects before and after surgery. B, The beta diversity in patients before surgery and 6 months after surgery was compared by Bray–Curtis distance and weighted Uni‐Frac. The significances of alpha and beta diversity were calculated using the Wilcoxon signed‐rank test and PERMANOVA with 999 permutations, respectively
