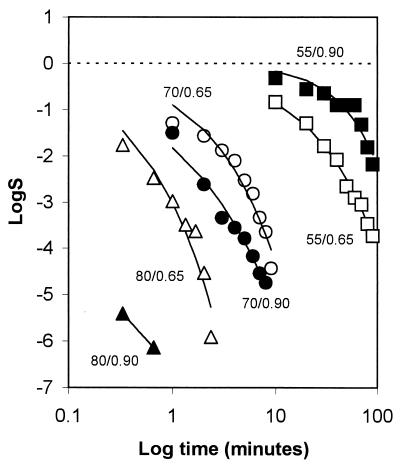
FIG. 1.
Graph of the log surviving serovar Typhimurium DT104 at 55°C (squares), 70°C (circles), and 80°C (triangles) and rvp 0.65 (open symbols) or 0.90 (closed symbols) plotted against log time in minutes, demonstrating the effect of the two water activities on the heat tolerance at three temperatures. The dashed line represents the initial CFU of Salmonella milliliter−1.

