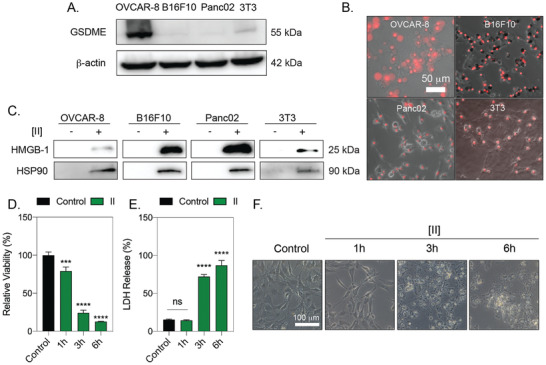
Figure 6.

[II] induced membrane rupture and DAMP release is not cell type‐specific. A) GSDME analysis of OVCAR‐8, B16F10, Panc02 and 3T3 cells. B) PI uptake at 6h of [II] treatment on cells. The scale bar is 50 µm C) HMGB‐1 and HSP90 release to the supernatant (SN) at 6h. D) Time dependent viability measurement. E) Time‐dependent LDH release. F) Phase‐contrast images of [II] treated fibroblasts at 1, 3 and 6h. The scale bar is 100 µm. Data are representative of at least three experiments. Statistical analysis was done by one‐way ANOVA test, data shown are mean ± SD,****p < 0.0001, ***p < 0.001.
