FIGURE 2.

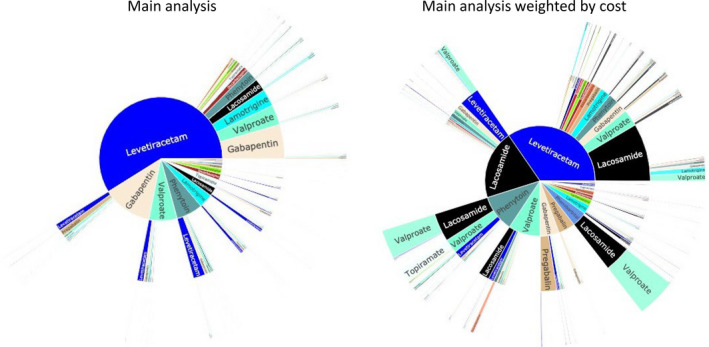
Unstratified sunburst plots. Left: Main population and main analysis (n = 1281 unique pathways). Right: Main population, but weighted by cost per pill day, whereas all other plots in this article were weighted by the sample size

Unstratified sunburst plots. Left: Main population and main analysis (n = 1281 unique pathways). Right: Main population, but weighted by cost per pill day, whereas all other plots in this article were weighted by the sample size