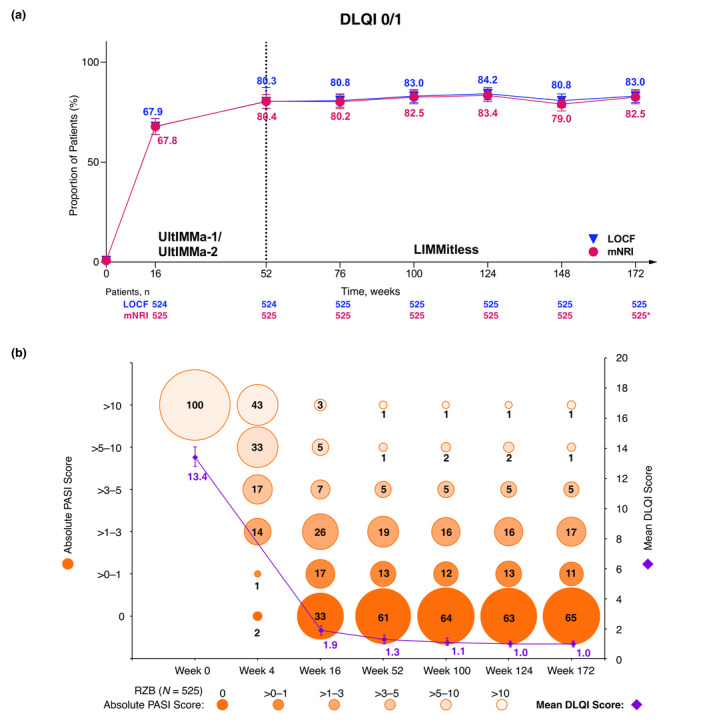
Figure 6.

Long‐term achievement of (a) DLQI 0/1 (mNRI and LOCF), (b) absolute PASI categories, and mean absolute DLQI (LOCF). (a) Percentage of patients achieving DLQI 0/1 over long‐term, continuous risankizumab treatment (mNRI and LOCF). Error bars represent 95% confidence interval based on the normal approximation. *The drop‐off in response rates (mNRI) is attributed to the lower number of observations at this timepoint, as many patients had not yet completed 172 weeks of treatment by the time of this analysis. Due to more missing data at this timepoint, the mixed‐effect analysis results in lower response rates. (b) Percentage of patients within absolute PASI categories and mean DLQI achieved by patients with long‐term, continuous risankizumab treatment (LOCF). Each circle represents the proportion of patients falling into each absolute PASI category; the whole numbers indicate that proportion rounded to the nearest percentage. All patients started the trials with a PASI > 10 since 1 of the inclusion criteria required patients to have a baseline PASI ≥ 12. DLQI, Dermatology Life Quality Index; LOCF, last observation carried forward; mNRI, modified non‐responder Imputation (imputed patients who discontinued due to worsening of symptoms as non‐responders; all other missing data handled using mixed‐effects models). PASI, Psoriasis Area and Severity Index; RZB, risankizumab.
