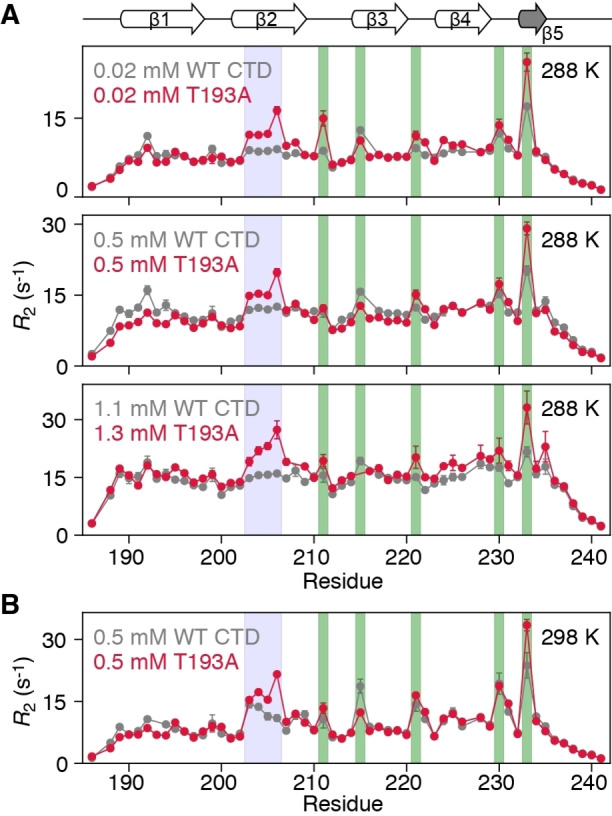
Figure 2.

The β2 strand of the T193A CTD shows increased dynamics that are not concentration‐dependent. 15N‐R 2 profiles for WT CTD (grey) and T193A (red) at A) 288 K and various concentrations and B) 298 K and 0.5 mM. The data were recorded at 600 MHz with a 15N‐R 1ρ sequence [14] and a 1.5 kHz spinlock field, and then converted to R 2 values. Residues in the β2 strand, hairpins are highlighted with blue, green boxes respectively. If error bars are not visible, they are smaller than the circles representing the experimental data point.
