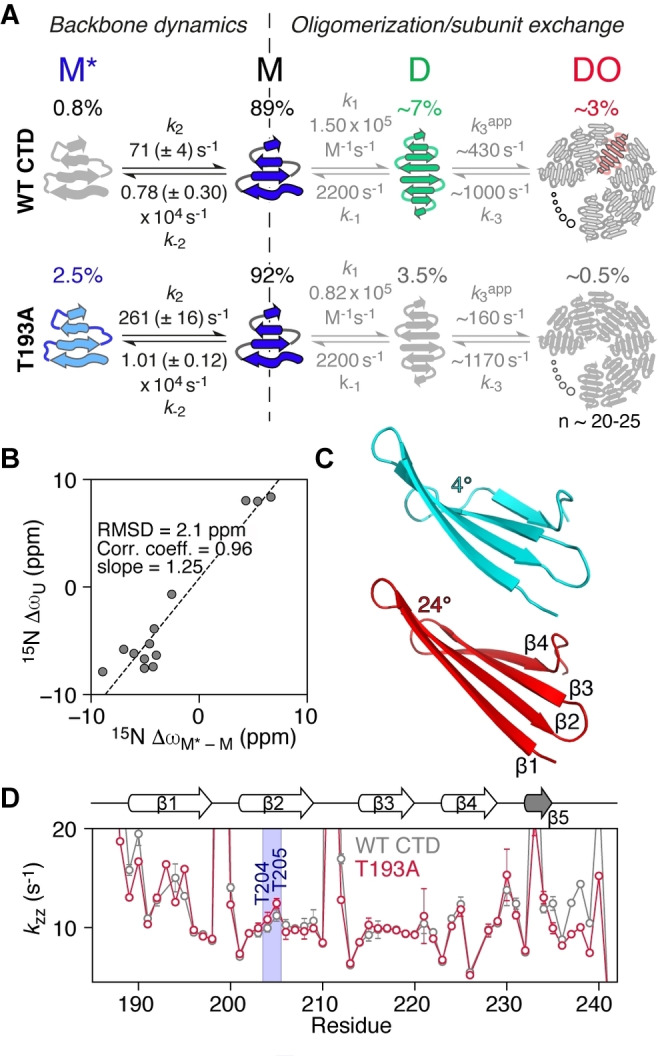
Figure 4.

The T193A mutation redirects CTD oligomerization by promoting the formation of a partially folded state. A) 4‐state kinetic model used to fit the relaxation data for WT (top) and T193A (bottom) CTDs. The kinetic parameters for the M↔D↔DO oligomerization pathway (grey text) were determined in ref. [9b]. Twisted arrows depict a partially folded structure (M*) or a twisted β1 strand in M. [9b] Straight arrows in D depict a straight β1. [9b] B) Correlation of the fitted chemical shift differences for the M−M* transition (ΔωM‐M*) with the differences in chemical shift between random coil and folded states (ΔωU) for the T193A mutant. C) A cartoon representation of strands β1 to β4 in the T193A CTD when the twist angle for residues 203–206 is set to 4° (cyan) or 24° (red) using twistPot (the value observed in the refined T193A structure is ≈20°). A morph between these two structures is provided as Supplementary Video 1. D) k ZZ rates obtained using the DÉCOR experiment [24] at 298 K and 600 MHz as a function of residue number for the WT (grey) and T193A (red) CTDs. k zz, the relaxation rate of HzNz two spin order, is dominated by amide proton exchange with solvent (see also Figure S6C).
