FIGURE 4.

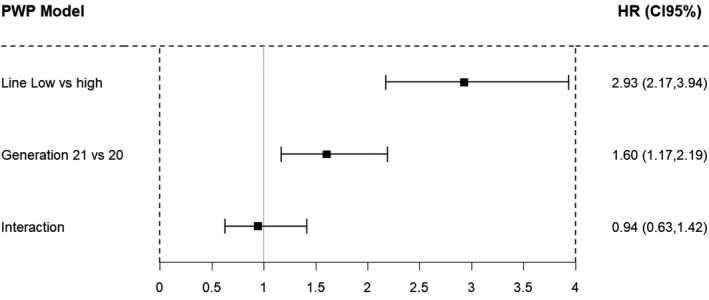
Estimated hazard ratios (HR) for the rate of a new parturition (PNP). Reference groups were high birth weight variability line and generation 20. PWP Model: Prentice–Williams–Peterson model

Estimated hazard ratios (HR) for the rate of a new parturition (PNP). Reference groups were high birth weight variability line and generation 20. PWP Model: Prentice–Williams–Peterson model