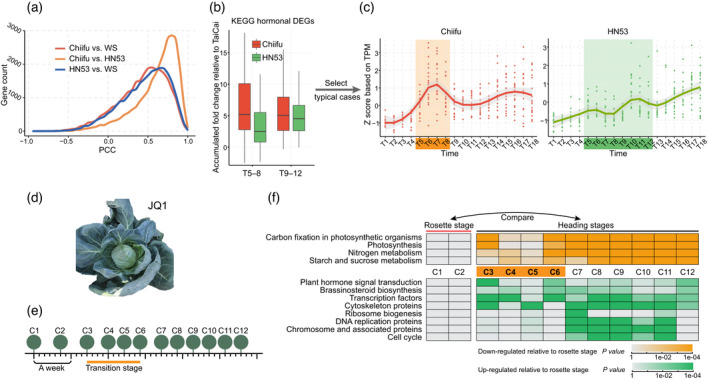
Figure 3.

Conservation of the heading transition stage in heading Brassica rapa HN53 and in cabbage JQ1.
(a) Line chart illustrating the Pearson's correlation coefficient distribution of different pairs (Chiifu vs. WS, HN53 vs. WS, and Chiifu vs. HN53).
(b) Plant hormone‐associated genes exhibit different expression patterns in Chiifu and HN53. Kyoto Encyclopedia of Genes and Genomes (KEGG) genes were upregulated during the transition stage of Chiifu as compared with WS. Their fold‐changes (red) relative to WS in the transition and heading growth stages were calculated. Their performances in HN53 (green) were also collected using the same method. DEGs, differentially expressed genes.
(c) Expression patterns of hormone‐associated genes in Chiifu (left) and in HN53 (right) are exemplified by typical cases. Differences in expression patterns are consistent with the tendency reflected by the boxplots (d). TPM, transcript per million.
(d) Snapshot of the heading cabbage JQ1.
(e) Sampling strategy for cultivar JQ1. In total, 12 leaf samples were collected with the sampling interval indicated, using days as the unit.
(f) KEGG gene enrichment based on the DEGs between heading stages and the rosette stage of JQ1. Upper panel shows the enriched KEGG pathways (orange) based on genes that were downregulated in the heading stages compared with the rosette stage; bottom panel shows the pathways (green) based on genes that were upregulated in the heading stages compared with the rosette stage. Orange highlights (in c left and f) denote the transition stage of Chiifu (T5–8) and JQ1 (C3–6), respectively, while the green highlight (c right) shows the potentially longer transition stage of HN53 (T5–12). [Colour figure can be viewed at wileyonlinelibrary.com]
