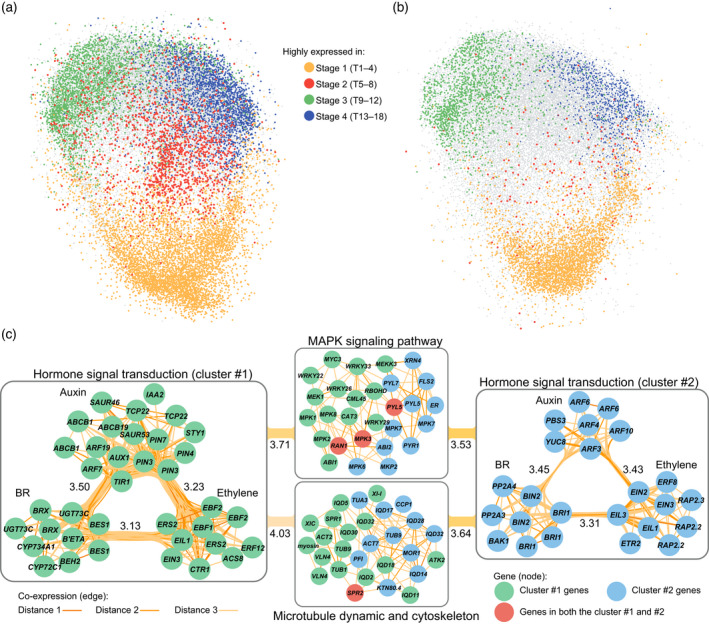
Figure 5.

Co‐expressed gene clusters and pathways in the co‐expression network built for Chinese cabbage.
(a) Snapshot of the co‐expression network for Chiifu with genes highly expressed during different stages highlighted by different colors. Connections among genes (here as edge) and the isolated gene pairs were omitted. Visualization was conducted using the “preferred layout” in Cytoscape. (b) Snapshot of the co‐expression network for WS, the non‐heading control. The color of node was determined according to whether the genes marked with color in (a) were still highly expressed in corresponding stage in WS. If they did, these genes were colored same as in (a). If not, these genes were colored as gray. (c) Two triple‐hormones‐involved co‐expressed clusters are indicated by circles with different colors (green and blue). The color of genes in the MAPK and microtubule clusters were assigned according to the color of the hormonal cluster to which they connected in the network. Edge color indicates the value of the shortest path (distance) between two genes in the co‐expression network. Distance = 1 means that two genes are directly connected, while distance = 2 or 3 means that they were indirectly connected via one or two bridging intermediate gene(s), respectively. Numbers labeled beside the intra−/inter‐connections indicate the average distance between two gene clusters. Smaller numbers indicate closer connections. The gene prefix “Br” was omitted from the gene name. Owing to the abundance of multi‐copy genes in B. rapa, being descended from a recent hexaploidy event, genes marked with same name indicate different copies, such as the BES1s and EIN3s. BR, brassinosteroid. [Colour figure can be viewed at wileyonlinelibrary.com]
