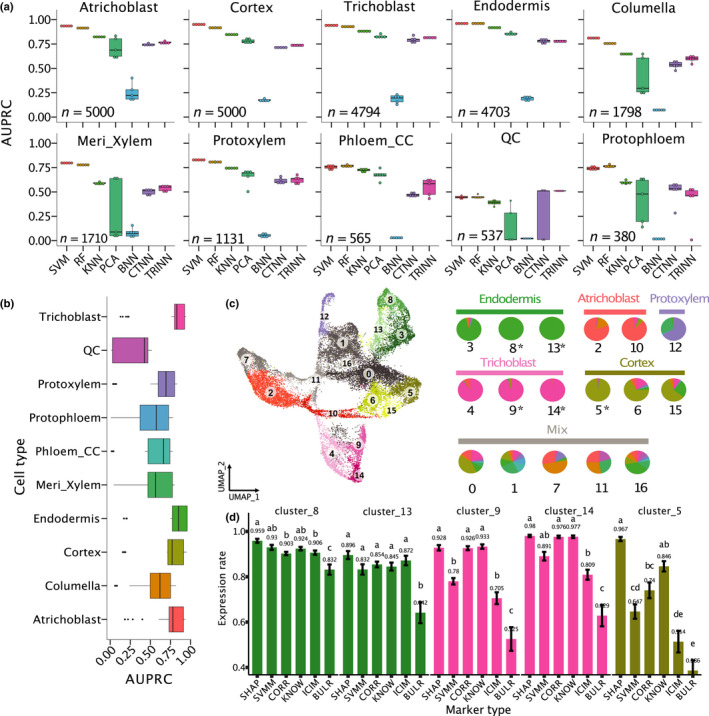
Fig. 1.

Classification performance of 10 root cell types of Arabidopsis. (a) Comparison between seven machine learning models on cell type classification. AUPRC, area under precision‐recall curve; SVM, support vector machine; RF, random forest; KNN, K‐nearest neighbours; PCA, principal component analysis; and BNN, CTNN and TRINN, baseline, contrastive and triplet neural networks. In these boxplots, the mid‐horizontal line represents the median and dots represent data points. (b) Comparison of classification performance of all the 10 cell types. Dots represent outliers. Colour coding for cell types in (b, c, d) is the same. (c) A UMAP plot where cells were clustered into 17 clusters. If one cell type is represented in more than one cluster, each cluster has a slightly different colour to distinguish the clusters. For example, green is used to represent endodermis, and clusters 3, 8 and 13 in the UMAP are all coloured in green. The right pie plot indicates cell composition in each cluster (Supporting Information Table S5). If over 50% of cells in a cluster belong to the same cell type, this type is defined as the dominant cell type. The labels above the pies are names of the dominant cell types of the clusters. Otherwise, the label for the clusters is ‘Mix’. *, clusters with > 95% of cells belong to the same cell type. (d) Comparisons of proportion of expressed cells among the six marker types. All pairwise comparisons are statistically significant as indicated by different letters. If two bars have the same letter, then they are not significantly different from each other. Error bars represent ±SE.
