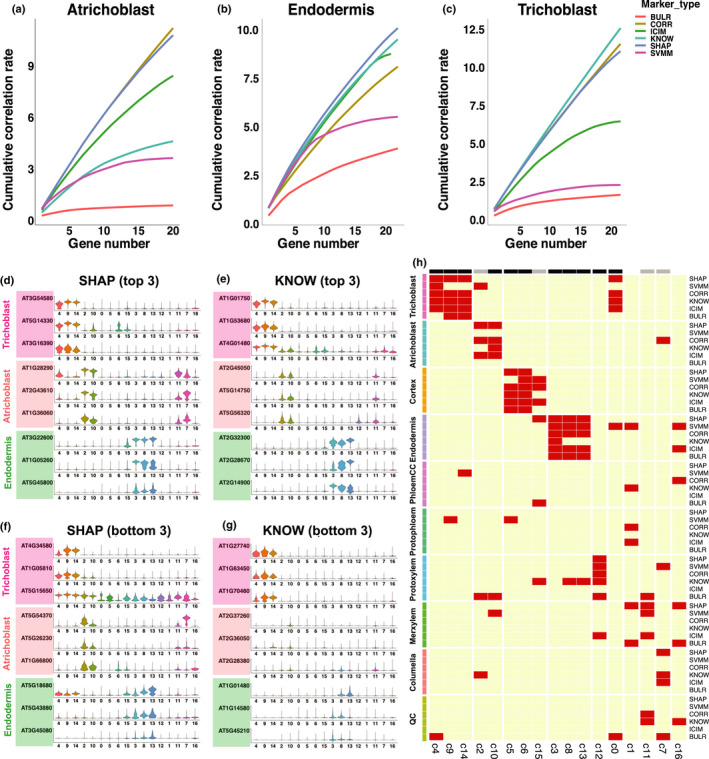
Fig. 2.

Assignments of cell identity using newly developed Arabidopsis markers. (a–c) Cumulative correlation plot for top 20 markers for six types of markers. (d–g) Violin plots that show the expression of top three markers (d, e) and bottom three markers (f, g) in three cell types, across all clusters. Only distributions of the marker gene expression are shown in (d–g). (h) Heat map of cell types assigned to each cluster by different markers. On top of the heat map, black bars show clusters assigned consistently by four or more methods, and grey bars show clusters assigned consistently by three out of six methods.
