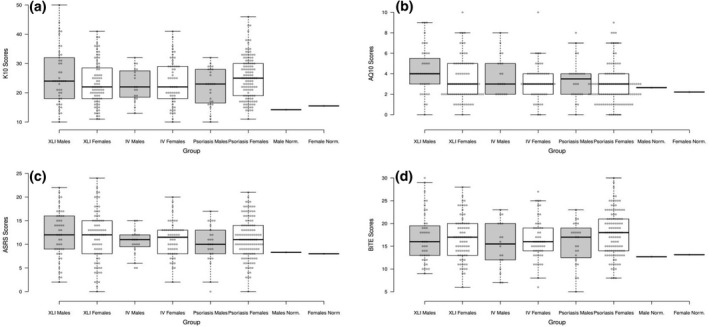
Figure 1.

Boxplots showing scores on (a) the Kessler psychological distress scale (K10), (b) the short Autism Spectrum Quotient (AQ10), (c) the Adult Attention Deficit Hyperactivity Disorder Self‐report Scale (ASRS) Part A and (d) the Brief Irritability Test (BITE) across all six experimental groups. Centre lines show the medians, box limits indicate the 25th and 75th percentiles as determined by R software, and whiskers extend 1.5 times the interquartile range from the 25th and 75th percentiles. Mean values for general population normative samples for both men and women are shown for comparison. IV, ichthyosis vulgaris; XLI, X‐linked ichthyosis.
