Figure 2.

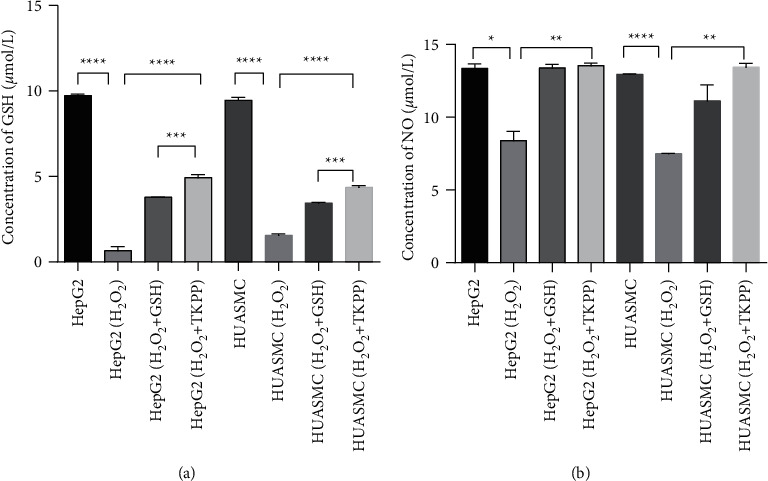
The expression detection of GSH and NO in different groups. (a) The level of GSH in oxidized HepG2 and HUASMC cells. (b) The NO secretion in oxidized HepG2 and HUASMC cells. ∗P < 0.05, ∗∗P < 0.01, ∗∗∗P < 0.001, and ∗∗∗∗P < 0.0001.

The expression detection of GSH and NO in different groups. (a) The level of GSH in oxidized HepG2 and HUASMC cells. (b) The NO secretion in oxidized HepG2 and HUASMC cells. ∗P < 0.05, ∗∗P < 0.01, ∗∗∗P < 0.001, and ∗∗∗∗P < 0.0001.