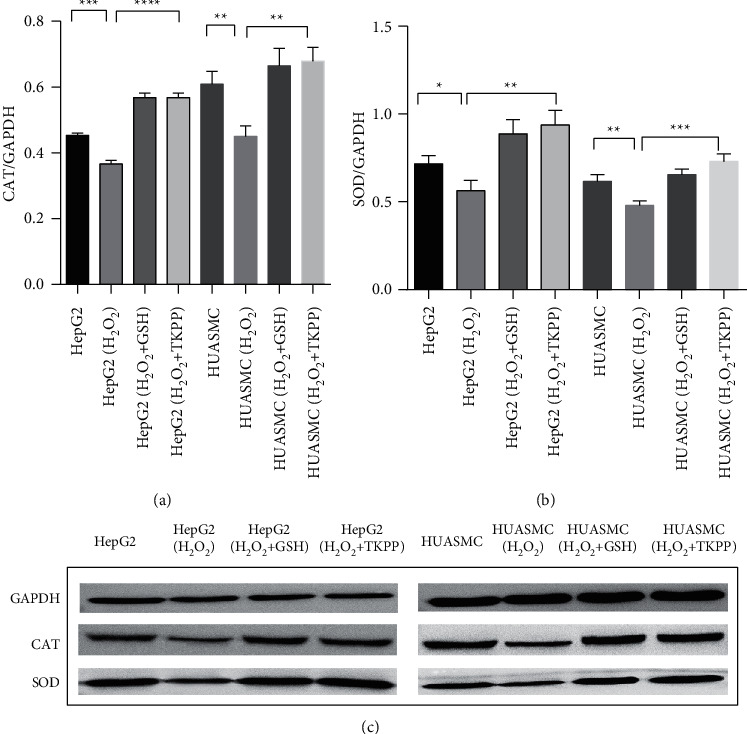
Figure 4.

Protein expression detection of CAT and SOD in TKPP group. (a) Band intensity of CAT protein expressions in each group. (b) Band intensity of SOD protein expressions in each group. (c) Immunoblotting of CAT and SOD proteins in each group. ∗P < 0.05, ∗∗P < 0.01, ∗∗∗P < 0.001, and ∗∗∗∗P < 0.0001.
