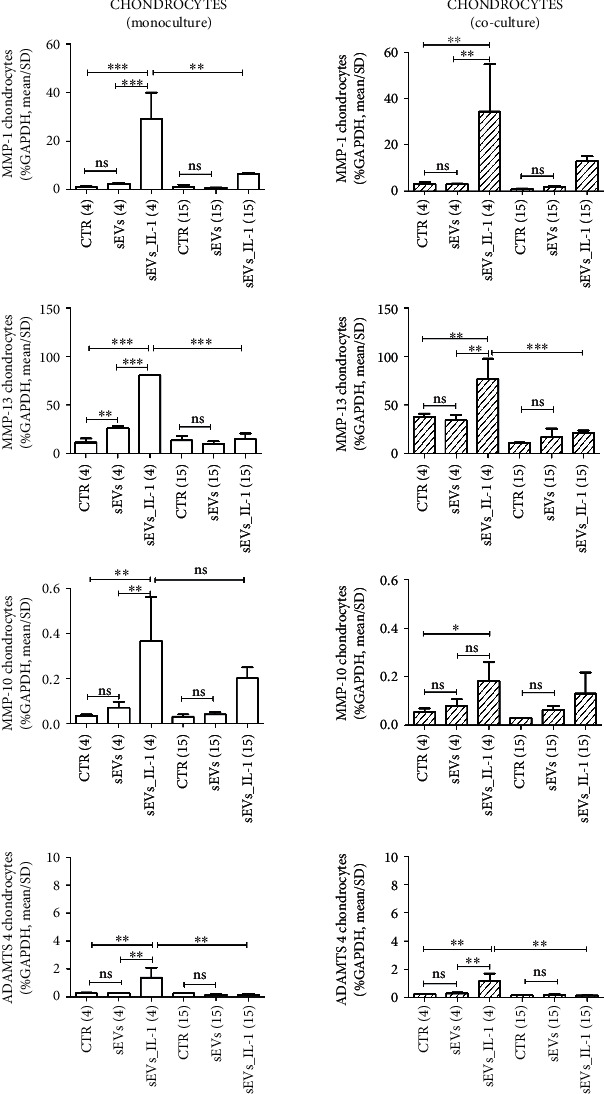
Figure 3.

sEVs_IL-1 effects on gene expression of catabolic genes in chondrocytes kept in control conditions. The figure reports the effects on gene expression of major catabolic enzymes (MMP-1, MMP-13, MMP-10, and ADAMTS 4) in chondrocytes grown in both monoculture (white pattern, left graphs) and co-cultured with synoviocytes (white dashed pattern, right graphs) in CTR, sEVs, or sEVs_IL-1 conditions. Data were normalized to GAPDH. Each graph reports data collected from 3 independent sEVs samples and expressed as mean ± SD. The means of the groups were compared by ANOVA, followed by Tukey's post hoc test, with ∗p < 0.05, ∗∗p < 0.01, and ∗∗∗p < 0.001.
