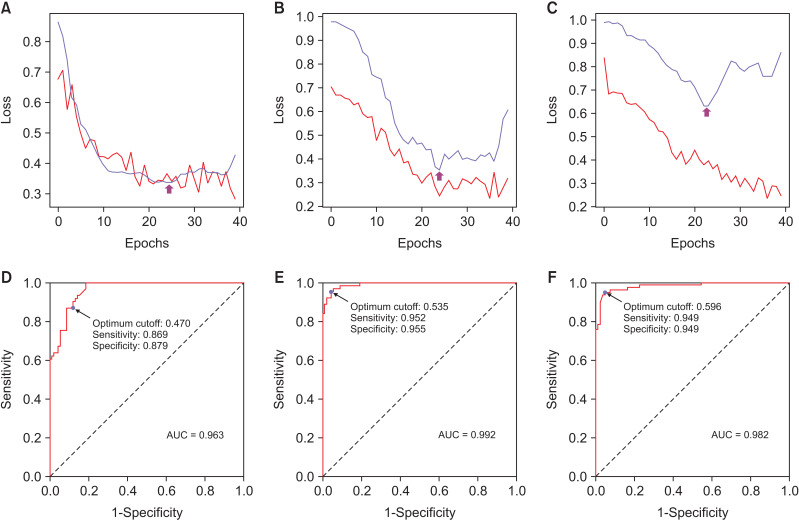
Figure 2.
Prediction performance of the artificial neural networks (ANNs). The learning curves of ANNs for pain (A), anxiety (B), and quality of life (C). Red lines represent train loss curve; purple lines, validation loss curve. Arrows indicate the lowest point of validation loss curve, which means the training procedure for pain, anxiety, and quality of life are stopped at 25, 24, and 22 epochs, respectively. The ROC curves of ANNs for pain (D), anxiety (E), and quality of life (F). The optimum diagnostic cutoff value is marked as purple points, where the sensitivity and specificity are shown upon the arrows.
ROC, receiver operating characteristic; AUC, area under the curve.

