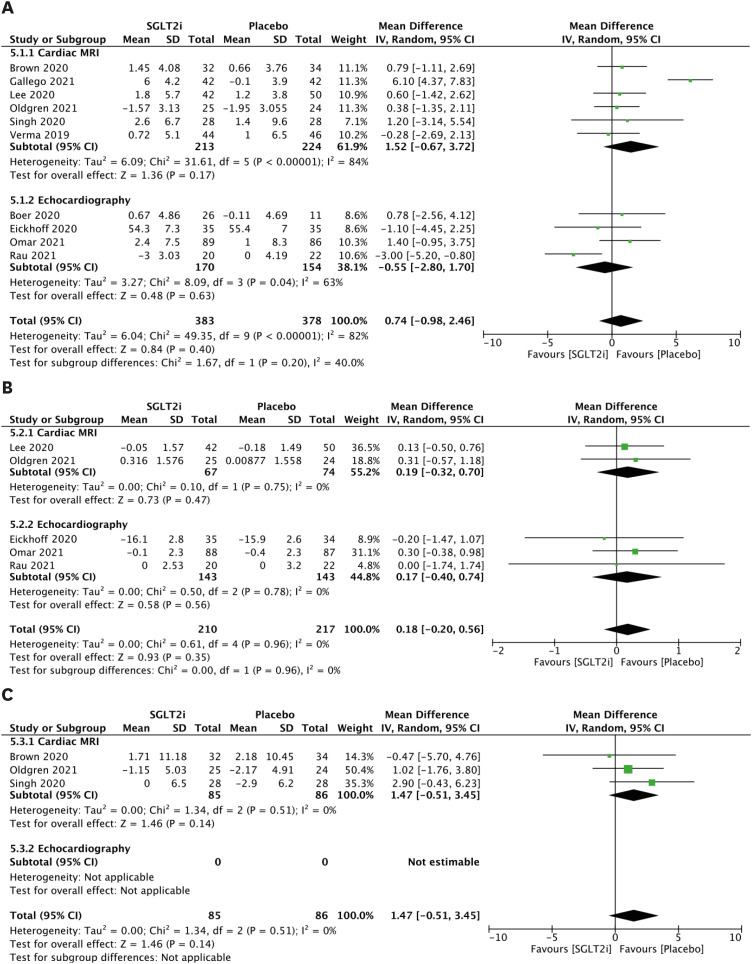
Figure 5. LV function parameters. (A) Forest plot of mean change in LVEF in %. (B) Forest plot of mean change in LVGLS in %. (C) Forest plot of mean change in stroke volume in mL.
CI: confidence interval, IV: interval variable, LV: left ventricular, LVEF: left ventricular ejection fraction, LVGLS: left ventricular global longitudinal strain, MRI: magnetic resonance imaging, SD: standard deviation, SGLT2i: sodium-glucose cotransporter 2 inhibitor.

