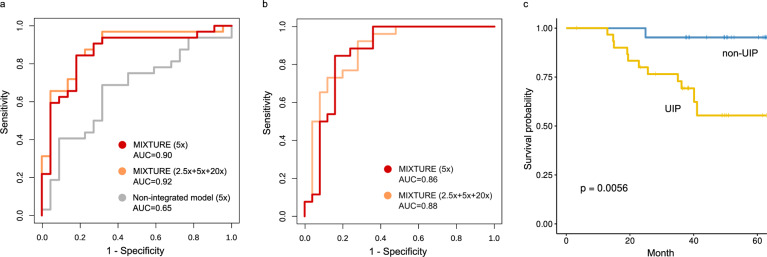
Fig. 5. Receiver operating characteristic curves to predict the presence of UIP and survival analysis based on the UIP.
a ROC curve on the independent validation set. Red curve indicates the models with findings obtained at 5x, similarly orange line with 2.5x + 5x + 20x (orange). Gray curve is a model without pathologist integration of findings (non-integrated model). The case with the best AUC (k = 8) is presented. b ROC curve on the independent test set. Red curve indicates the models with findings obtained at 5x, similarly orange line with 2.5x + 5x + 20x (orange). c Survival curves comparing the cases predicted UIP and non-UIP. The model created using tiles extracted at 5x magnification. Cases predicted as UIP had a significantly worse prognosis than those predicted as non-UIP.

