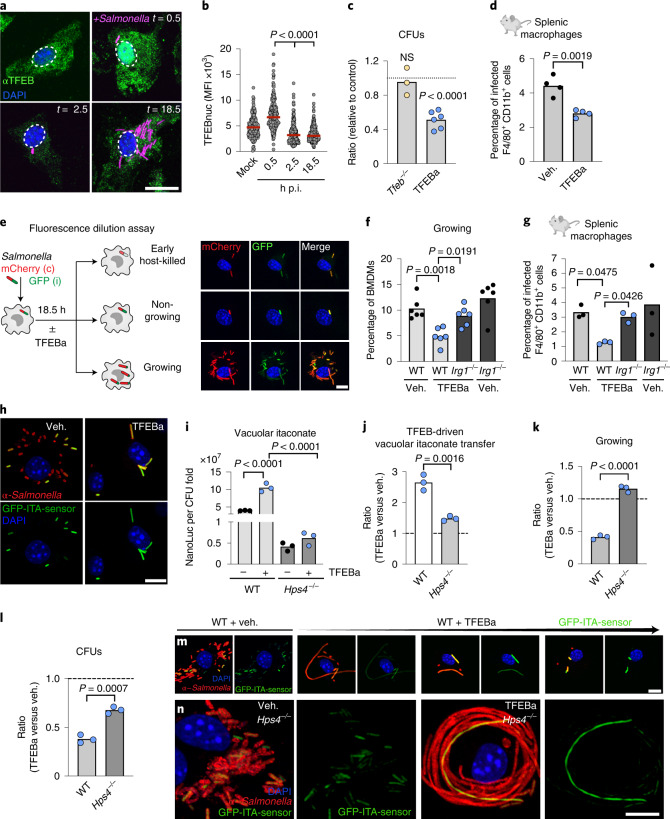
Fig. 4. TFEB-driven itaconate production reduces intracellular Salmonella growth in infected macrophages.
a, Indirect immunofluorescence against endogenous TFEB. Scale bar, 15 µm. b, Quantification of nuclear TFEB levels from a. Graph shows nuclear TFEB mean fluorescence intensity from n = 170 cells examined over n = 3 independent experiments. P values were calculated using one-way ANOVA with Dunnett’s post hoc. c, Ratio of CFUs of Tfeb−/− to WT or TFEBa relative to vehicle-treated BMDMs from n = 3 (Tfeb−/−) or n = 6 (TFEBa) independent experiments. P values were calculated using two-tailed one-sample t-test, NS P > 0.05. d, Percentage of infected splenic macrophages treated with TFEBa or PBS. Bars show mean from n = 4 mice and P values were calculated using unpaired, two-sided Student’s t-test. e, Strategy to identify different Salmonella subpopulations inside macrophages and corresponding images. Scale bar, 10 µm. f, Percentage of cells with growing Salmonella in WT or Irg1−/− BMDMs treated or not with TFEBa and analysed by flow cytometry. Bars show mean from n = 6 independent experiments. P values were calculated using one-way ANOVA with Tukey’s post hoc. h, Percentage of infected splenic macrophages of TFEBa- or PBS-treated WT or Irg1−/− mice. Bars show mean from n = 3 mice. P values were calculated using one-way Welch’s ANOVA, with Dunnett’s post hoc test. h, Images of BMDMs infected with GFP-itaconate sensor-carrying Salmonella, treated or not with TFEBa for 18.5 h. Scale bar, 10 µm, images are representative of n = 4 independent experiments. i,j, Luciferase measurements from NanoLuc-ITA-Salmonella-infected BMDMs (normalized to fold-change CFU) (i) and as ratio of TFEBa- to vehicle-treated BMDMs (j). Graphs show mean of n = 3 independent biological experiments. P values were calculated using one-way ANOVA with Tukey’s post hoc test (i) and unpaired, two-sided Student’s t-test (j). k, Ratio of cells containing growing bacteria in TFEBa and vehicle-treated WT or Hps4−/− BMDMs (based on Extended Data Fig. 5g). Bars show mean of n = 3 independent experiments. P values calculated using unpaired, two-sided Student’s t-test. l, Ratio of CFUs in TFEBa and vehicle-treated WT or Hps4−/− BMDMs. Dashed line indicates vehicle-treated control level. Bars show mean of n = 3 independent experiments. P values were calculated using unpaired, two-sided Student’s t-test. m,n, Images of GFP-ITA-Salmonella-infected WT and Hps4−/− BMDMs, treated or not with TFEBa. Images are representative of n = 3 independent experiments. Scale bars, 10 µm.

