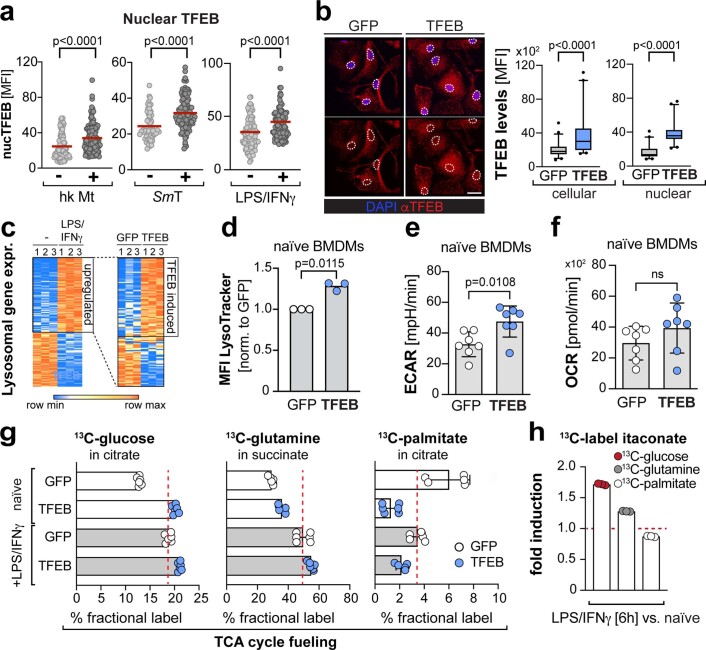
Extended Data Fig. 1. TFEB activation induces the expression of lysosomal and metabolic genes.
a, Quantification of nuclear TFEB levels from BMDMs treated or not for 30 min with heat-killed Mycobacterium tuberculosis (hk Mt, 10 µg/mL), living Salmonella Typhimurium (SmT, MOI 5), or LPS/IFNγ (15 min), related to Fig. 1a-c. Quantification represents (a) N = 101, 117 (b) N = 56, 115, (c) N = 109, 99 cells examined over n = 2 independent experiments. Red lines indicate the mean and p-values were determined using unpaired, two-sided Student’s t-test. b, Quantification of cellular and nuclear TFEB induction in the TFEB activation mimic and GFP-expressing control cells, quantified from images of cells immune-stained against endogenous TFEB. Scale bar: 10 µm. Box plots (box: 25–75 percentile, middle line: median, whiskers: 5-95 percentile) of N = 52 (GFP), N = 41 (TFEB) cells examined over of n = 2 independent experiments. P values were calculated using unpaired, two-sided Student’s t-test. c, Heatmaps of lysosomal genes from RNA-seq analysis in: (left panel) naïve versus 24 h LPS/IFNγ treated, GFP-expressing BMDMs; (right panel) naïve BMDMs expressing TFEB-GFP or GFP. d, Quantification of LysoTracker fluorescence in TFEB-GFP- and GFP-expressing BMDMs by flow cytometry. Bars represent mean ± s.d. of n = 3 independent experiments. Pvalues were calculated using two-tailed one-sample t-test. MFI: median fluorescent intensity. e,f, Metabolic measurements from TFEB-GFP- or GFP-expressing BMDMs, showing (e) extracellular acidification rates (ECAR) and (f) oxygen consumption rates (OCR). Bars show mean ± s.d. from n = 7 independent biological replicates. Statistics derived from two-sided, unpaired Student’s t-tests. n.s. for P > 0.05. g,h, TCA cycle fueling determined by metabolic labelling of TFEB-GFP- and GFP-expressing BMDMs with 13C-glucose, or 13C-glutamine, or 13C-palmitate in the presence or absence of LPS/IFNγ. Results are based on GC-MS/MS measurements. (g) Bar graphs present fractional label of 13C-glucose in citrate, 13C-glutamine in succinate, and 13C-palmitate in citrate. Bars show mean ± s.d. from (left and middle panel) n = 6 and (right panel) n = 5 (GFP) and n = 6 (TFEB) biologically independent samples. (h) Itaconate-fueling from 13C-labelled glucose, glutamine and palmitate in 6 h LPS/IFNγ-treated BMDMs relative to naïve BMDMs. Bars show mean ± s.d. from n = 3 biologically independent samples.

