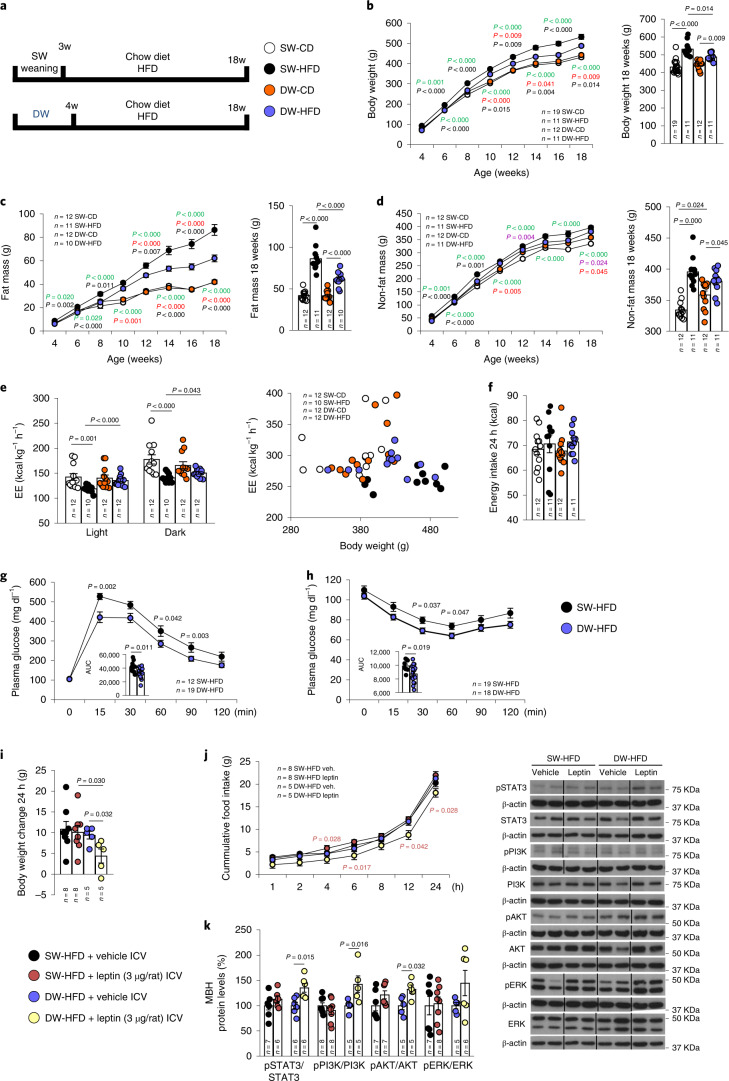
Fig. 1. Prolonged suckling (delayed weaning) decreases body weight and fat mass while increasing energy expenditure, with no change of food intake in rats.
a, Timeline of the experimental protocol. b–h, Effects of delayed weaning on body weight (b); fat mass (c); non-fat mass (d); energy expenditure (EE) in light and dark phases and as a function of body weight (e); energy intake over 24 h (f); glucose tolerance (g); and insulin response (h). i–k, In rats fed an HFD, effect of delayed weaning on response to ICV administration of leptin (3 μg per rat) in terms of body weight change (i), cumulative food intake (j) and MBH protein levels of pSTAT3, STAT3, pPI3K, PI3K, pAKT, AKT, pERK and ERK (k). Protein data were expressed as percentages in relation to control (SW-HFD vehicle) animals. β-actin was used to normalize protein levels. Dividing lines indicate splicing within the same gel. Values are represented as means ± s.e.m., n per group. Exact P values are shown. Statistical differences between groups are indicated by the following colours: black, SW-HFD versus DW-HFD; green, SW-CD versus SW-HFD; violet, SW-CD versus DW-CD; red, DW-CD versus DW-HFD. Statistical differences were determined by one-way analysis of variance (ANOVA; normal data and homogeneity of variances) followed by Tukey’s post hoc multiple-comparison test (b–d, f and j) or a two-sided Student’s t-test (normal data; g and h), a two-sided Mann–Whitney U test (non-normal data and non-homogeneous variance; e, i and k), or an analysis of covariance (ANCOVA) with body weight as a covariate (e). AUC, area under the curve.

