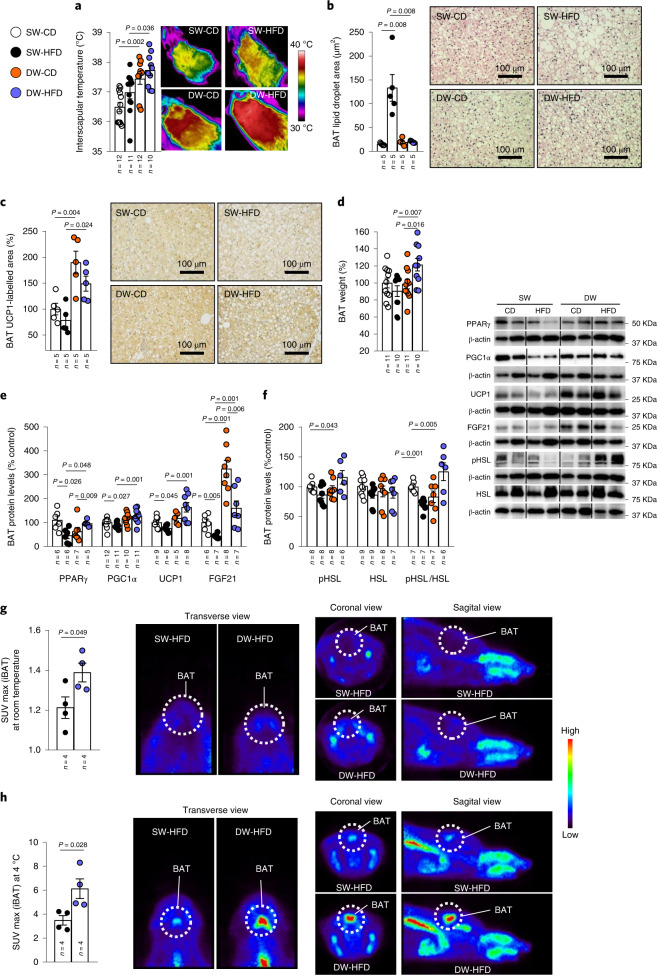
Fig. 3. Prolonged suckling activates BAT thermogenesis and browning of WAT.
a–h, Effects of delayed weaning shown on infrared thermal images and quantification of BAT interscapular (iBAT) temperature (n = 10–12; a); quantification of lipid droplet cross-sectional area in BAT (n = 5; b); quantification of immunolabelling for UCP1 in BAT (n = 5; c); BAT weight (n = 10–11; d); BAT protein levels of PPARγ, PGC1α, UCP1 and FGF21 (n = 5–12; e) and pHSL, HSL and pHSL/HSL (n = 6–9; f); 18F-FDG uptake analysis (standardized uptake value (SUV max)) of rats at room temperature (n = 4; g); and 18F-FDG uptake analysis of rats at 4 °C (n = 4; h). Protein data were expressed as percentages in relation to control (SW-CD) animals. β-actin was used to normalize protein levels. Dividing lines indicate splicing within the same gel. Values are represented as means ± s.e.m., n per group indicated in each figure. Exact P values are shown. Statistical differences were determined by one-way ANOVA (normal data and homogeneity of variances) followed by Tukey’s post hoc multiple-comparison test (a and c) or a two-sided Student’s t-test (normal data; g and h) or a two-sided Mann–Whitney U test (non-normal data and non-homogeneous variance; b and d–f).

