
Fig. 2.
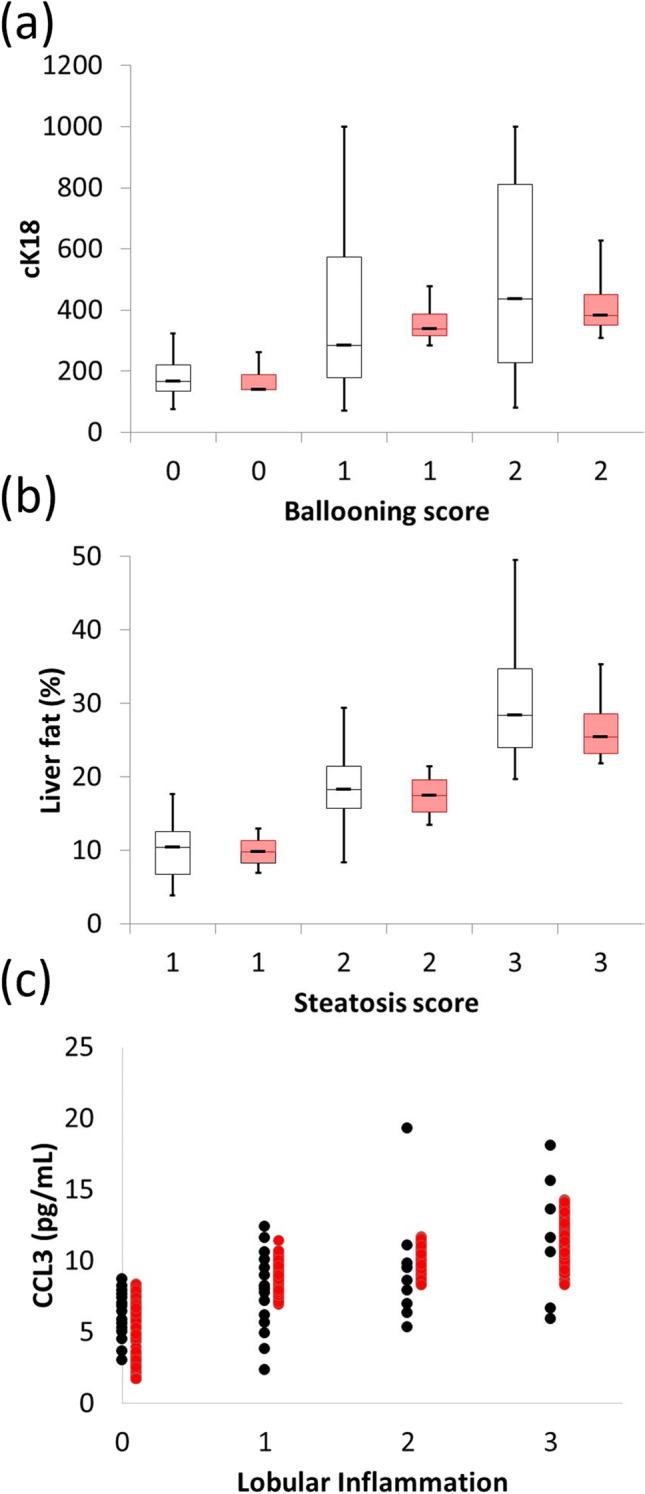
Simulation results and clinical data describing the correspondence between the simulated histologic components of NAS with related outputs. The range of cytokeratin-cleaved K18 (cK18) and histologic ballooning (a), liver fat measured by MRI-PDFF and histologic steatosis (b), andCCL3 and histologic lobular inflammation scores. Red bars or symbols denote results from simulated patients while black symbols and black bars denote clinical data from Aida et al. (a), Middleton et al. (b), and du Plessis et al. (c).