Fig. 4.
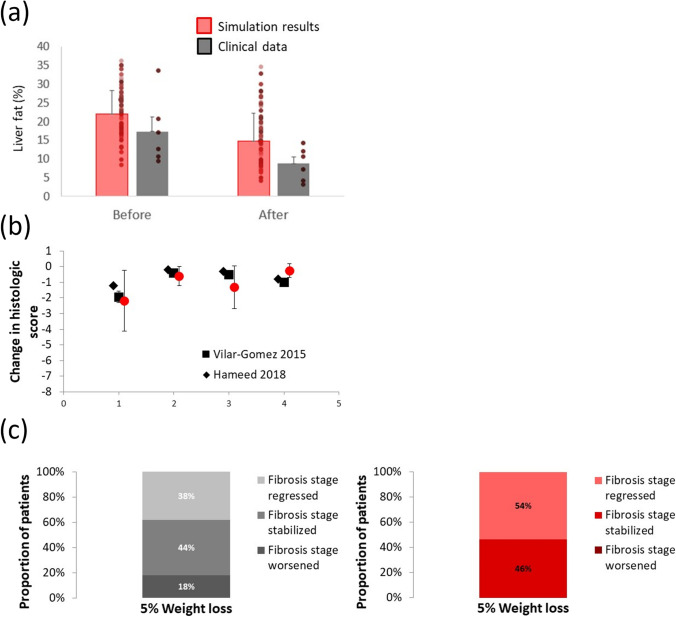
Simulation results and clinical data illustrating the appropriate degree of relief in simulated NASH patients in response to 5–10% weight loss achieved via restriction of caloric intake. Liver fat before and after six months of 10% weight loss, as compared with clinical data from Smith et al. Mean responses and individual simulated and clinical patient results displayed (a); absolute change in overall NAS and respective components after 5–7% weight loss over 12 months, as compared with clinical data from Vilar-Gomez et al. and Hameed et al. Note that a negative value indicates reduction relative to initial values (b); fraction of patients with worsened, stabilized, or regressed fibrosis stage after 12 months of 5–7% weight loss, as compared with clinical data from Vilar-Gomez et al. (c). Clinical results are summarized in figure on left, while simulation results are in figure on right Red bars or symbols denote results from SimCohorts while black or gray symbols denote clinical data.

