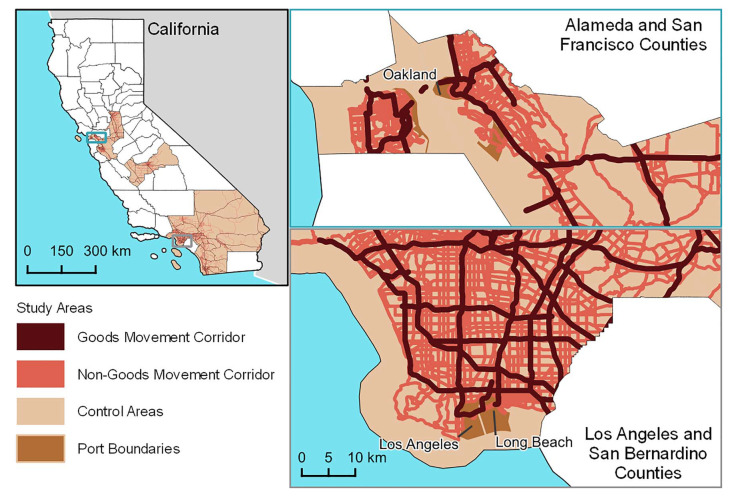
Commentary Figure 1.
Map of Southern California, with the goods movement corridors, non-goods movement corridors, control areas, and ports shown. Data sources: goods movement corridors courtesy of Jason Su; California county and state boundaries from the California OpenData Portal based on the U.S. Census Bureau’s 2016 MAF/TIGER Database (https://data.ca.gov/dataset/ca-geographic-boundaries [accessed 26 January 2021]); port boundaries from California Department of Transportation (www.arcgis.com/home/item.html?id=ca25a3a15fa2448c801499638300780e [accessed 12 March 2021]); U.S. boundary from the Census Bureau’s MAF/TIGER geographic database www.census.gov/geographies/mapping-files/time-series/geo/carto-boundary-file.html [accessed 12 March 2021]).

