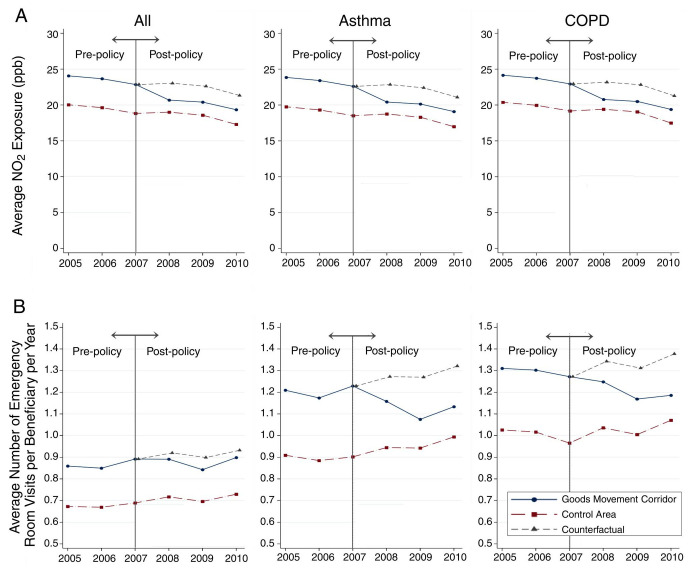
Commentary Figure 2.
Average NO2 exposure levels (A) and emergency room visits (B) among all beneficiaries, those with asthma, and those with COPD from the pre-policy (2005-2007) to post-policy (2008-2010) study periods. After 2007 policy implementation, reductions were greater for goods movement corridors (solid blue line) compared with control areas (long-dashed red line). The counterfactual (gray short-dashed line) indicates the expected trend for the goods movement corridor if the Goods Movement Plan had not been implemented. (Adapted from Figure 5 in Investigators’ Report.)

