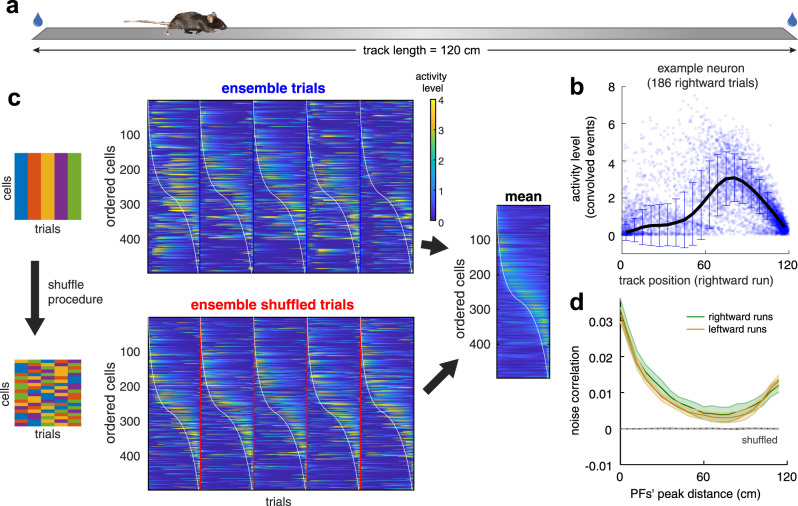
Fig. 1. Noise correlation in the neuronal activity of the mouse CA1 area.
a Mice ran back and forth along a linear track of length L = 120 cm and collected water rewards at each end of the track. b Example neuron’s activity level for different spatial locations. Activity level based on normalized amplitudes of detected events convolved with an alpha function (see Methods) for each visit to each spatial location (dots) relative to mean values across visits (continuous line). Error bars are the 95% confidence intervals over 186 trials. c Left: Schematic of the shuffling procedure, where we mixed neurons’ responses (columns) across different trials (rows) for the entire track. Center: Stack of maps of individual cells’ trial-by-trial PFs along the track for cells monitored together within a single imaging session, ordered by the maximum activity level for a given rightward running direction (for one session from animal 2022). Individual trials show response fluctuations relative to mean responses (Right) (the white line generated for visualization purposes was obtained from the leftmost end of PF’s widths (smoothed across neighboring neurons/horizontal lines) computed on the distribution of mean responses (Right)). Right: The mean response over trials for all recorded cells was unaffected by the shuffling procedure. d Noise correlations between neurons as a function of distance between PF peaks (3,941,140 pairs from 110 sessions from 12 mice). The solid lines and shaded areas represent means and 95% confidence intervals, respectively. The shuffling procedure drastically reduced noise correlations in the shuffled data. Source data is provided as a Source Data file.

