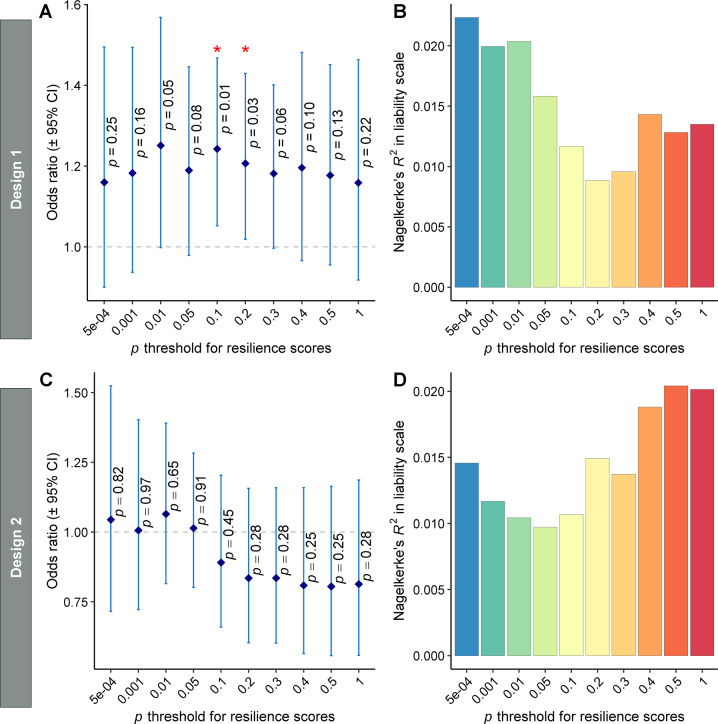
Fig. 2. The performance of polygenic resilience scores in capturing resilience variability in independent replication studies.
In design 1, normal controls with late-onset Alzheimer’s disease (LOAD) polygenic risk scores (PRSs) ≥90th percentile were defined as “resilient” participants. In design 2, a threshold of ≥80th percentile of PRSs (excluding SNPs in the apolipoprotein E [APOE] region) was used to define high-risk controls as “resilient” within the normal controls who have at least one APOE-ε4 allele. A, B design 1 (high-risk normal controls, n = 1,056; risk-matched LOAD cases, n = 381). C, D Design 2 (high-risk normal controls, n = 583; risk-matched LOAD cases, n = 331). The odds ratio (OR) and variance explained by polygenic resilience scores reflect meta-analytic results from independent replication samples. Nagelkerke’s pseudo-R2 values on the liability scale are weighted average using the weights from the meta-analysis of ORs. The dot-plots (A, C) show corresponding ORs for resilience scores across 10 P-value thresholds, wherein OR > 1.0 indicates higher resilience scores are associated with a higher likelihood of being a high-risk normal control (“resilient” individual) than being a risk-matched LOAD case. Error bars represent the 95% confidence intervals (CI) around each OR, which are the exponent of the 95% CI of β coefficients. The barplots (B, D) show the amount of variance in resilience (i.e., “resilient” high-risk normal controls versus risk-matched LOAD cases) on the liability scale that is explained by resilience scores. Asterisks (*) indicate P values <0.05 for ORs >1.0.

