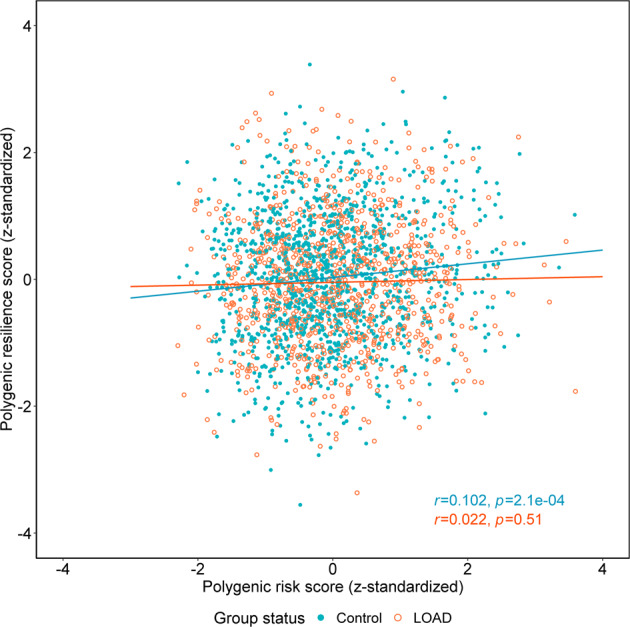
Fig. 3. The correlation of standardized polygenic risk scores (PRSs) and polygenic resilience scores (design 1) in normal controls and late-onset Alzheimer’s disease (LOAD) cases.

The analyses were performed in three independent replication studies not used in the resilience score derivation steps (i.e., ADC7, AddNeuroMed, and ADNI-GO/2/3; normal controls, n = 1321; LOAD cases, n = 943). The optimal P-value threshold for polygenic risk-scoring was 0.5, and the optimal P-value threshold for polygenic resilience scoring was 0.1 (see Fig. 2). The blue round dots indicate normal controls, and the orange circles indicate LOAD cases. The blue and orange lines represent the best fit for correlations between PRSs and resilience scores in normal controls and in LOAD cases, respectively. The blue and orange annotation text shows the Pearson correlation coefficient (r) and the P-value between PRSs and resilience scores in normal controls and LOAD cases, respectively. In this analysis, we excluded ultra-high-risk LOAD cases whose PRSs are higher than the maximum of all normal controls, and ultra-low-risk normal controls whose PRSs are lower than the minimum of all LOAD cases.
