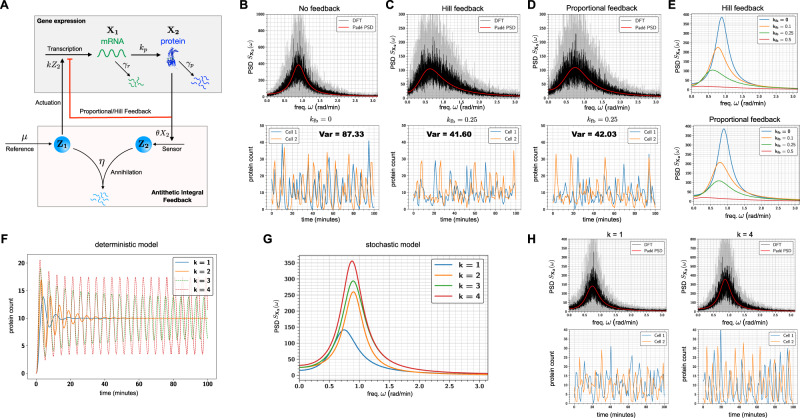
Fig. 4. Reducing single-cell oscillations due to the AIF controller.
A Depiction of the biomolecular antithetic integral feedback (AIF) controller regulating the gene expression network. Here mRNA (X1) is the actuated species and the protein (X2) is the output species. This protein output is sensed by the controller species Z2 which annihilates the other controller species Z1 that is constitutively produced at rate μ. The species Z1 actuates the gene expression network by catalysing the production of mRNA X1. The red arrow indicates an extra negative feedback from the output species (protein) to the production of the actuated species (mRNA). In B, the single-cell oscillatory trajectories for the protein counts (without the extra feedback) are plotted and the corresponding PSD is estimated with Padé PSD and the DFT method. C Same plots as in panel (B) for Hill feedback with . D Same plots as in panel (B) for proportional feedback with . For other values of kfb, comparison plots between Padé PSD and DFT are provided in Fig. S5(A) in the Supplement. The plots for the single-cell trajectories in panels (B–D) also indicate the total signal power which is equal to the stationary output variance (see Box 1). Notice the ≥ 50% reduction in this variance in the presence of feedback. E Comparison of the PSDs estimated with the Padé PSD method for the Hill and proportional feedback for three choices of feedback parameter kfb. In F, we simulate the deterministic model for this network (without the extra feedback) for four values of the actuation rate constant k. Notice that for lower values of k, the deterministic trajectories converge to a fixed point, but for higher values of k sustained oscillations emerge. This is quite different from the stochastic case, where oscillations persist even though their power continuously decreases as k decreases, as seen in panel (G) from the plots of PSDs obtained with the Padé PSD method. H Comparison of the PSDs estimated with Padé PSD and the DFT method for two values of k (for other values see Fig. S5(B) in the Supplement). All the PSDs were estimated with Q = 10 simulated trajectories.

