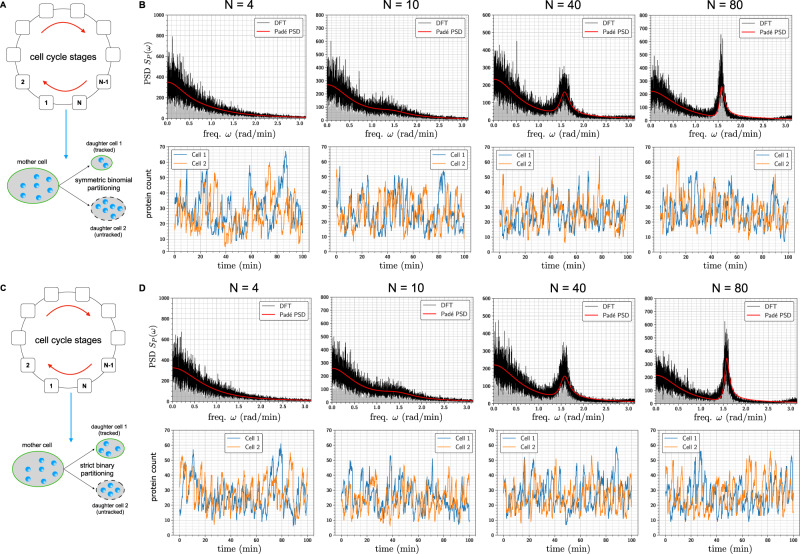
Fig. 7. Cell-cycle induced oscillation in gene expression.
We model the cell-cycle evolution as a N-stage Markov process with a constant rate α of transitioning from one stage in the cycle to the next. When the transition is from state N to state 1, the mother cell splits into two daughter cells, from which only one cell is tracked and measured. At the time of the split, the mother cell molecules are partitioned in one of two ways—symmetric binomial (i.e. each molecule has a 50% chance of ending up in the tracked cell) and strict binary (i.e. the tracked cell receives exactly half of the molecules of each network species). These two scenarios are depicted in panels (A) and (C). In panel B (resp. panel (D)), we suppose that the cell undergoing symmetric binomial (resp. strict binary) partitioning, contains the gene expression network shown in Fig. 2A. We plot the single-cell trajectories for the protein counts as well as the corresponding PSDs estimated with the Padé PSD and the DFT methods for four values of the cell-cycle length N, keeping the cell-cycle frequency constant. All the PSDs were estimated with Q = 10 simulated trajectories.

