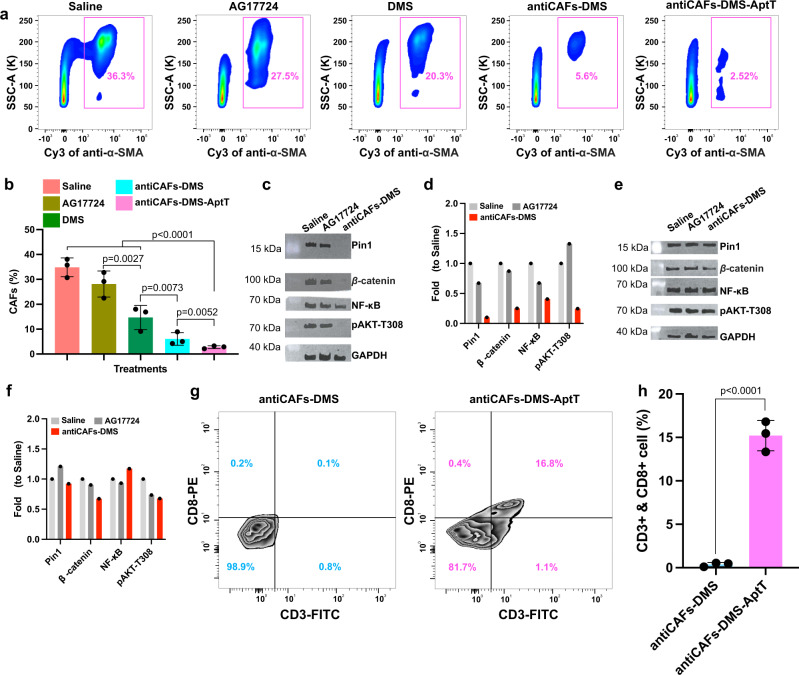
Fig. 6. Tumor tissue analysis on CAFs, Pin1, and T lymphocytes.
a, b Quantitative analysis, via cell sorting and counting, of CAFs in tumors from mice receiving different treatments (n = 3 biologically independent animals; error bars, mean ± SD). One way analysis of variance followed by Turkey posttests. c Western blotting detection of Pin1 and relative proteins in sorted CAFs from tumors collected from mice treated with saline, AG17724 or antiCAFs-DMS. d Quantitative analysis of the western blotting results of sorted CAFs (Three independent repetitions got similar results.). e Western blotting detection of Pin1 and relative proteins in non-CAFs cells from tumors collected from mice treated with saline, AG17724, or antiCAFs-DMS. f Quantitative analysis of the western blotting results of non-CAFs cells (Three independent repetitions got similar results.). g, h Quantitative analysis, via cell sorting and counting, of CD8+ T lymphocytes in tumors from mice treated with antiCAFs-DMS or antiCAFs-DMS-AptT (n = 3 biologically independent animals; error bars, mean ± SD). Two-tailed Student’s t tests. Source data are provided as a Source Data file.

