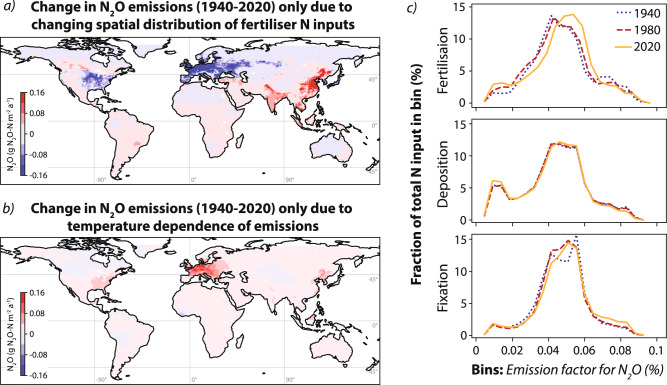
Fig. 4. Impact of changing spatial distribution of fertilisation as well as climate warming on N2O emissions from 1940 to 2020.
a The average change in annual N2O emissions due to the shifting spatial distribution of fertiliser N inputs, calculated using the 1940 spatial distribution of fertilisation scaled to the 2020 total fertilisation quantity as a baseline, and comparing this to the actual modelled 2020 emissions. b The average change in annual N2O emissions due to climate warming and the temperature dependency of N2O production, found by calculating 2020 emissions with and without the impact of warming on EFs since 1940. c The proportion of anthropogenic N inputs from fertilisation, deposition and fixation in 1940, 1980 and 2020 accounted for within bins defined according to the EF for N2O. 20 bins were used; 19 were distributed evenly between the parameter minimum and the mean + 3 standard deviations; the highest bin was for all data >mean + 3 standard deviations. Maps generated with Cartopy (Met Office, 2015,132).

