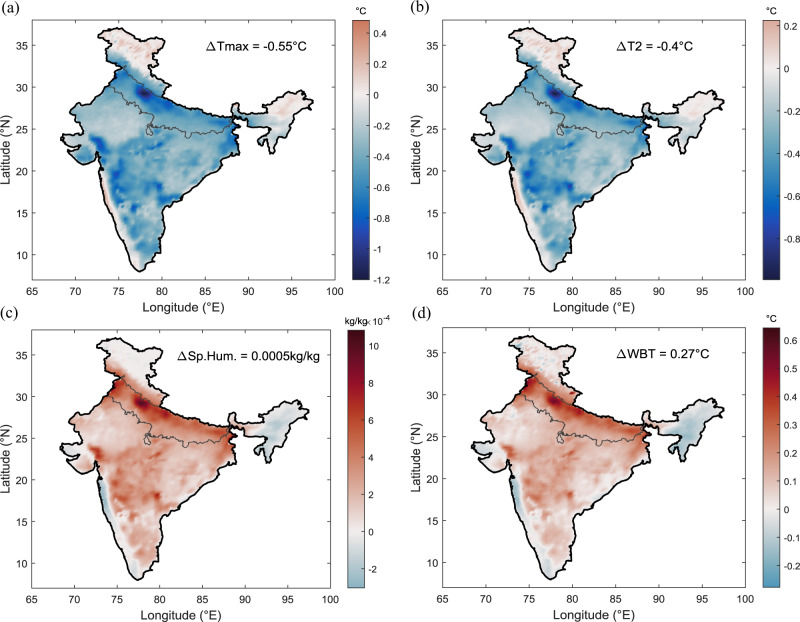
Fig. 3. Influence of agricultural census-based irrigation on air temperature, specific humidity, and wet-bulb temperature (Tw).
Difference between AGR and CTL experiment during pre-monsoon season (April–May) for the period 2004–2016 for a Daily maximum temperature (°C). b Daily mean temperature (°C). c Specific humidity (kg/kg). d Wet-bulb temperature (°C). CTL represents WRF-CLM4 simulation with no irrigation and AGR represents WRF-CLM4 simulation with agricultural census-based irrigation data.

