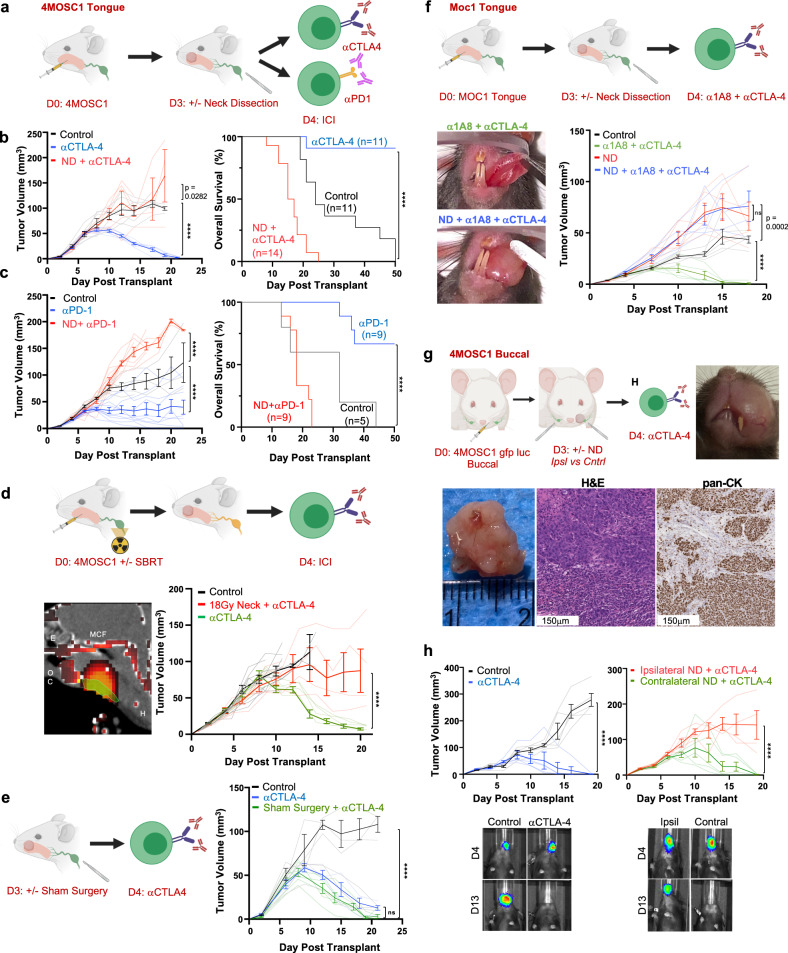
Fig. 2. Draining lymphatic basins are required for tumor response to immune checkpoint inhibition.
a Experimental schema for b, c. b Left: Representative tumor growth kinetics from 4MOSC1 tumor-bearing animals treated with αCTLA-4 following neck dissection (ND, red lines) or no surgery (blue lines) (n = 6/group); right: compiled overall survival data (ND + αCTLA-4 ICI, red lines n = 14; αCTLA-4 monotherapy, blue lines n = 1; control, black lines n = 11). c Left: Representative tumor growth kinetics from 4MOSC1 tumor-bearing animals treated with αPD-1 following ND (red lines) or no surgery (blue lines) (n = 9/treatment group, n = 5 control); right: compiled overall survival data (ND + αPD-1 ICI, red lines n = 9; αPD-1 monotherapy, blue lines n = 9; control, black lines n = 5). d Top: Experimental schema; bottom left: representative sagittal CT image illustrating a single 18 Gy dose of radiation therapy targeting the cervical lymphatics (green indicates the area of contouring; red heatmap identifies the intensity of delivered ablative single fraction radiation therapy, OC = oral cavity, E = ethmoid, MCF = middle cranial fossa, H = hyoid). Bottom right: Representative tumor growth kinetics from 4MOSC1 tumor-bearing animals treated with αCTLA-4 monotherapy following 18 Gy delivered to the neck on day 0 (red lines, n = 5) or no radiation (green lines, n = 5) or control animals (black lines, n = 6). e Left: Experimental schema; right: tumor growth kinetics from 4MOSC1 tumor-bearing animals randomized to receive sham surgery and αCTLA-4 (green lines, n = 6), αCTLA-4 alone (blue lines, n = 5) or control (black lines, n = 3). f Top: Experimental schema; bottom left: representative photographs of MOC1 tumor-bearing animals treated with combination α1A8 + αCTLA-4 with or without ND at day 15; bottom right: Tumor growth kinetics comparing combination treatment (green lines) and treatment after neck dissection (blue lines) (n = 5 animals/group). g Top left: Experimental schema for h; top right: representative photograph of a 4MOSC1 buccal tumor, day 16 (representative of n = 5 animals); bottom: representative gross specimen and immunohistochemical images of buccal tumors stained with H&E or anti-pan-CK antibody (representative of n = 5 tumors). h Top: Tumor growth kinetics from 4MOSC1 buccal tumor-bearing animals treated with αCTLA-4 (blue lines, n = 5) versus control (black lines, n = 5) or following ipsilateral (red lines, n = 5) versus contralateral ND (green lines, n = 5); bottom: representative images of 4MOSC1-LucOS tumor-bearing animals after indicated IO treatment, day 4 or 13 after tumor transplantation and surgery at day 3 (n = 4–5 animals/group). The differences between experimental groups were analyzed using simple linear regression analysis (b, c, left, d, e, f, h); and, survival analysis was performed using the Kaplan–Meier method and log-rank tests (b, c, right). All data represent averages ± SEM, except where indicated. ****P < 0.0001. ns not statistically significant. Source data are provided as a Source Data file.

