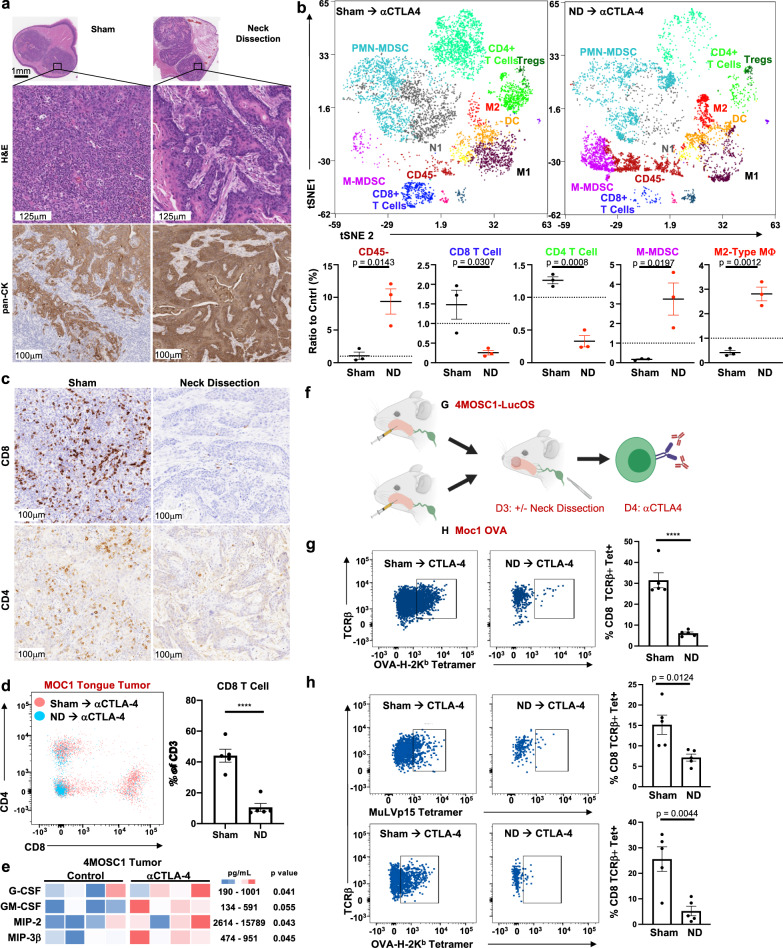
Fig. 3. Regional tumor-draining lymphatics coordinate antigen-specific CD8-driven immunity in the tumor microenvironment.
a Representative immunohistochemical images of 4MOSC1-tongue tumors from animals subjected to neck dissection or sham surgery followed by αCTLA-4 therapy, harvested at day 10. Shown are whole tumor sections, representative high-power H&E, and anti-pan-CK stained sections (representative of n = 5 tumors/treatment group). b Top: Representative tSNE plots shown from time-of-flight mass cytometry (CyTOF), comparing 4MOSC1-tongue tumors from animals subjected to neck dissection or sham surgery followed by αCTLA-4, harvested at day 10; bottom: quantification of selected populations identified in the TIME of the aforementioned groups (n = 3 samples/group). c Representative high-power IHC images probing for CD8+ or CD4+ cells in 4MOSC1-tongue tumors from animals subjected to neck dissection or sham surgery followed by αCTLA-4 therapy, harvested at day 10 (representative of n = 5 tumors/treatment group). d Flow plot and quantification comparing the CD4+ and CD8+ T-cell populations of MOC1 tongue tumors from animals subjected to neck dissection or sham surgery followed by αCTLA-4 therapy (red = sham surgery cohort, blue = neck dissection cohort, n = 5/group). e Heatmap comparing the expression of select chemokines and cytokines from the TIME of either control or αCTLA-4 treated 4MOSC1-tongue tumor-bearing animals at day 8 (n = 4/group). f Experimental schema—(g) 4MOSC1-LucOS or (h) MOC1-OVA tumors. Animals were randomized to receive sham surgery or neck dissection followed by treatment with αCTLA-4, after which tumors were harvested for flow cytometry to detect tumor-specific antigen tumor-infiltrating T cells. g Left: Representative flow cytometry plots and; right: quantification identifying TCRβ + OVA-H-2kb Tetramer+ CD8+ T cells from 4MOSC1-LucOS tumor-bearing animals harvested at day 10 after sham surgery or neck dissection and αCTLA-4 (n = 5/group). h Left: Representative flow cytometry plots; and right: quantification identifying TCRβ + MuLVp15 Tetramer+ or OVA-H-2kb Tetramer+ CD8+ T cells from MOC1-OVA tongue tumor-bearing animals harvested at day 10 after sham surgery or neck dissection and αCTLA-4 (n = 5/group). The differences between experimental groups were analyzed using independent, two-sided Student t tests (b, d, e, g, h). All data represent averages ± SEM, except where indicated. ****P < 0.0001. ns not statistically significant. Source data are provided as a Source Data file.

