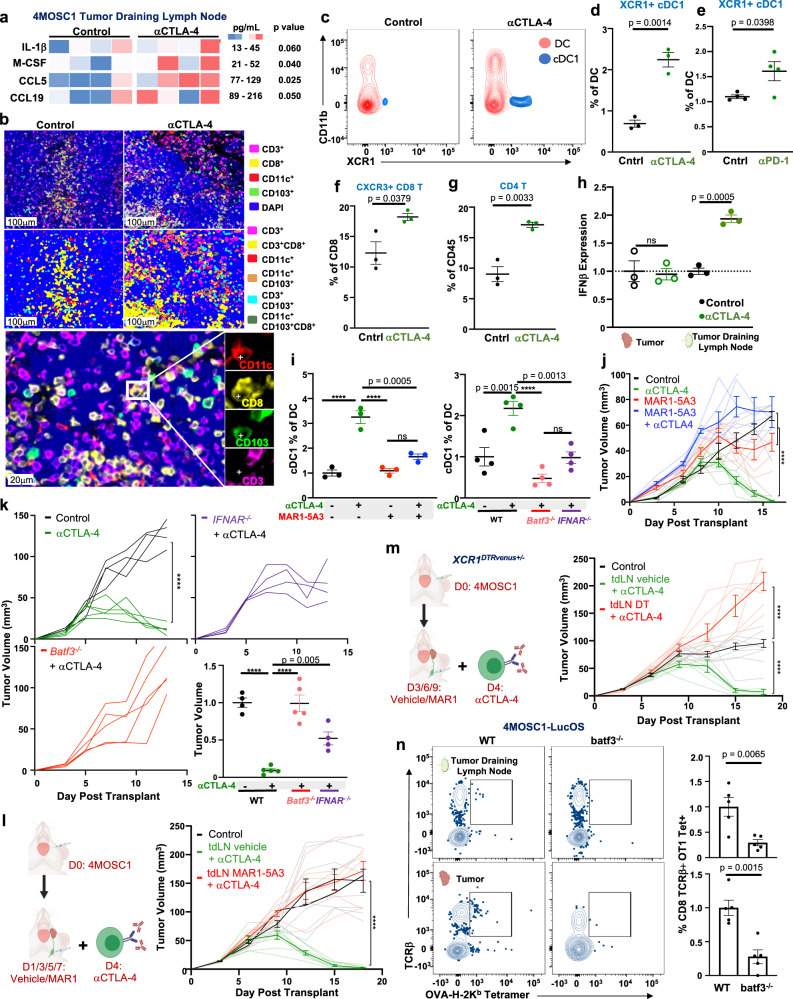
Fig. 4. Tumor-draining lymphatics harbor a population of conventional type I dendritic cells critical for the response to ICI.
a Heatmap comparing the expression of select chemokines and cytokines from tumor-draining lymph nodes of either control or αCTLA-4 treated 4MOSC1 tumor-bearing animals, day 8 (n = 4/group). b Representative multiplex immunofluorescence images identifying putative conventional type I dendritic cells (cDC1s) within the control or αCTLA-4 treated tdLNs from 4MOSC1 tumor-bearing animals, day 10 (representative of n = 10 tdLN/treatment group). c Representative flow cytometry contour plots identifying cDC1s (Ly6c-CD64-CD19-NK-CD11c + MHCIIhi CD11b-XCR1 +) from the tdLNs of control or αCTLA-4 treated 4MOSC1 tumor-bearing animals, day 10. d Quantification of cDC1s in tdLN after αCTLA-4 (n = 3). e Quantification of cDC1 in tdLN after αPD-1 (n = 4). f Quantification of activated CXCR3 + CD8+ T cells in the tdLNs of control or αCTLA-4-treated 4MOSC1 tumor-bearing animals, day 10 (n = 3). g Quantification of CD4+ T cells in the tdLNs of control or αCTLA-4-treated 4MOSC1 tumor-bearing animals, day 10 (n = 3). h IFNβ ELISA from tumor and tdLN from control or αCTLA-4 treated 4MOSC1 tumor-bearing animals, normalized to control, day 10 (n = 3). i Left: Quantification of cDC1s in the tdLNs of 4MOSC1 tumor-bearing WT animals treated with αCTLA-4 (green), MAR1-5A3 blocking antibody (red lines) or combination (blue lines) (n = 3 animals/group), day 10; (Right) and, in the tdLNs of WT (black), batf3–/– (red), or ifnar–/– (purple) animals treated with αCTLA-4 (n = 4 animals/group), day 10. j Tumor growth kinetics from 4MOSC1 tumor-bearing animals treated with αCTLA-4 (green lines, n = 7), MAR1-5A3 blocking antibody (red lines, n = 6), combination therapy (blue lines, n = 6) or control (black lines, n = 6). k Tumor growth kinetics from 4MOSC1 tumor-bearing WT control (black lines, n = 4) and αCTLA-4 treated animals (green lines, n = 5) versus αCTLA-4 treated batf3–/– (red lines, n = 5) or ifnar−/− (purple lines, n = 4); bottom right: tumor volume normalized to control at day 13. l Left: Experimental schema: 5 μg of MAR1-5A3 blocking antibody or vehicle was injected into the tdLN every 2 days, beginning day 1, for a total of 4 doses. Following the development of conspicuous tumors, animals were randomized to receive αCTLA-4. Right: Tumor growth kinetics from 4MOSC1 buccal tumor-bearing animals treated with αCTLA-4 ICI and tdLN-injected local IFNAR blockade (red lines) or vehicle (green lines) (n = 8 animals/treatment group). m Left: Experimental schema: 1 μg of diphtheria toxin or vehicle was injected into the tdLN every 3 days, beginning on day 3, for a total of three doses. Following the development of conspicuous tumors, XCR1DTRVenus+/– animals were randomized to receive αCTLA-4. Right: Tumor growth kinetics from 4MOSC1 buccal tumor-bearing animals treated with αCTLA-4 ICI and tdLN-injected local diphtheria toxin (red lines, n = 7) or vehicle (green lines, n = 7) versus control (black lines, n = 8). n Left: Representative flow cytometry plots and; right: quantification identifying TCRβ + OVA-H-2kb Tetramer+ CD8+ T cells from 4MOSC1-LucOS tongue tumor-bearing WT or batf3−/− animals, day 10 (n = 5). The differences between experimental groups were analyzed using independent, two-sided Student t tests (a, d–h, n, right), one-way ANOVA (i, k, bottom right) or simple linear regression analysis (j–m). All data represent averages ± SEM, except where indicated. ****P < 0.0001. ns not statistically significant. Source data are provided as a Source Data file.

